
More than 1,500 seagrass observations have been taken across five estuaries since November 2020 to map seagrass distribution.
This was the biggest monitoring season ever for the Department of Water and Environmental Regulation’s seagrass team, with three times more than the approximately 500 observations usually made in a year.
Dr Kieryn Kilminster, Estuary Science Section Manager at the department, said mapping five systems this year was a mammoth effort.
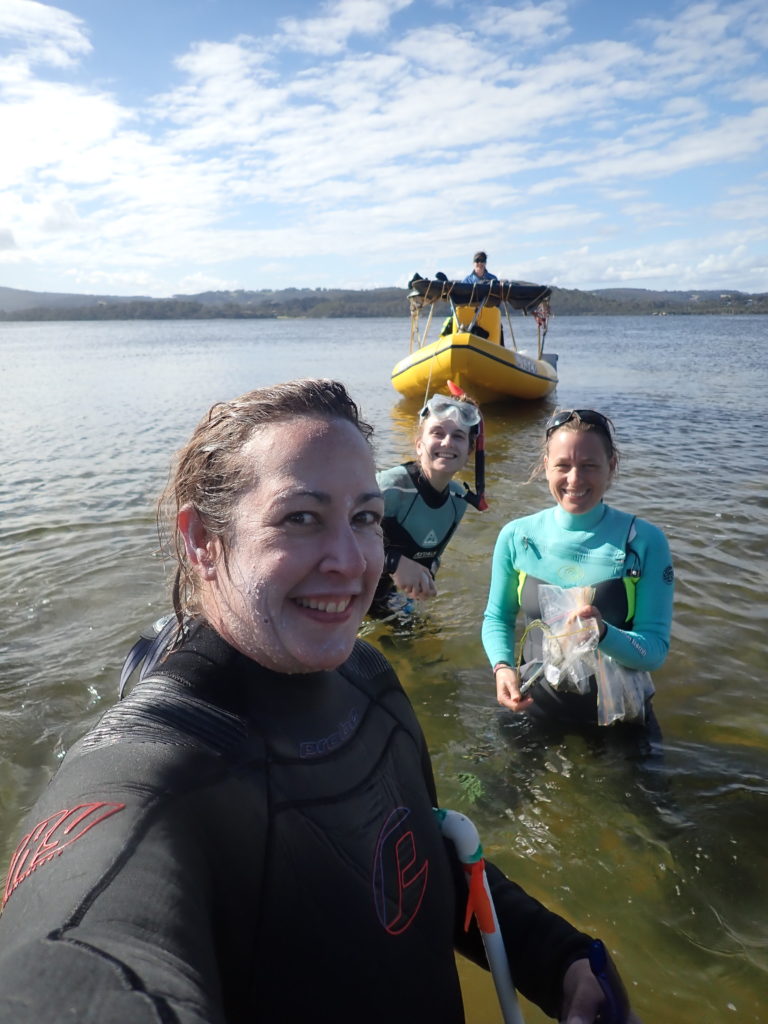
“It’s been a huge year for our team and for all of our colleagues that volunteered to help with fieldwork,” Kieryn said.
“We had 14 staff from across the regions and other branches of the department out on boats helping to take observations and samples. We couldn’t have done it without them.”
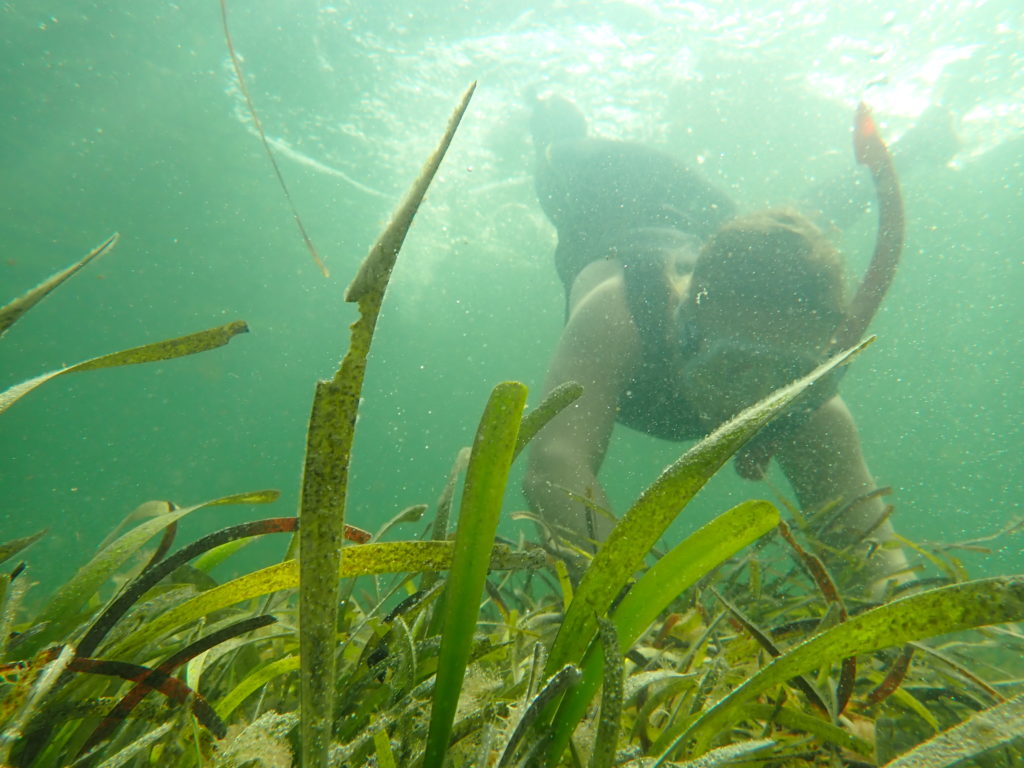
The department’s scientists use underwater cameras and viewing cones at between 150 and 500 sites in an estuary to see which species of seagrass are present and record their condition. This gives an insight into the health of the estuary and potential threats to the ecosystem.
From this data, the team builds seagrass distribution maps like the maps found in our latest report.
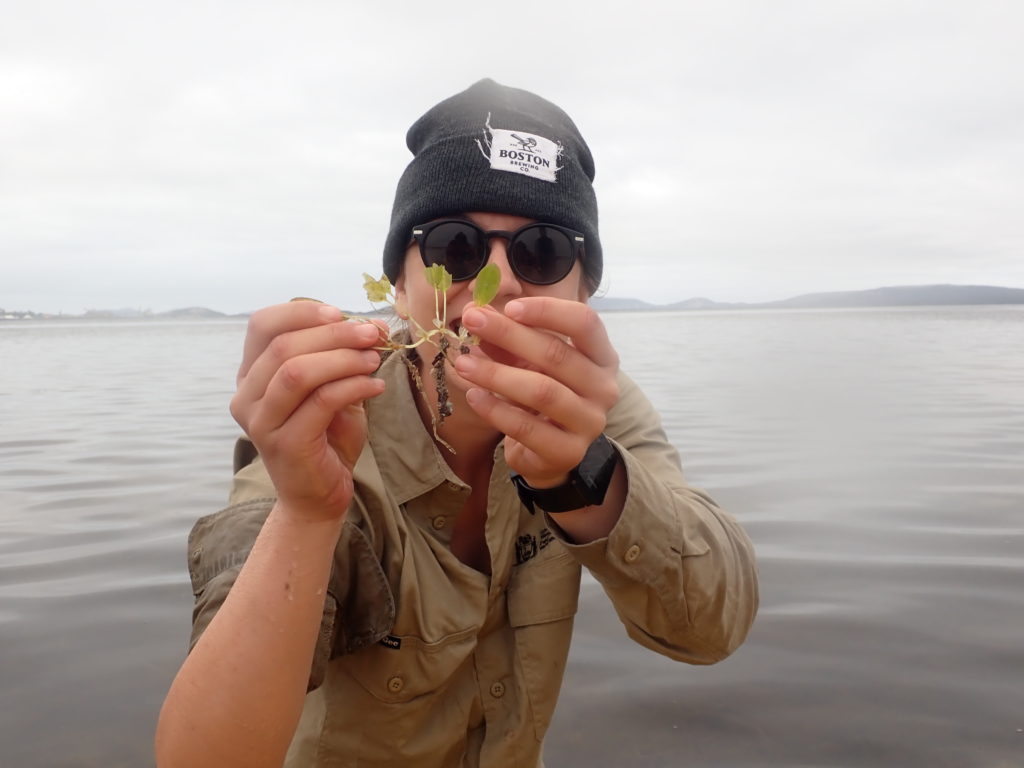
In addition to taking wide-scale observations, the seagrass team also takes samples from three to eight sites throughout an estuary. This allows them to track the health of seagrass closely, as well as understand why changes might be occurring.
Kieryn said that while this year’s efforts were substantial, monitoring of seagrass is a sustained effort that needs to occur regularly.
“Unlike seagrasses in marine environments, the health of seagrasses found in estuaries can change quite rapidly – so it’s important that we monitor seagrass regularly,” Kieryn said.
“Seagrasses need good water and sediment quality to thrive, so declines in seagrass condition or distribution can indicate an imbalance in our estuary ecosystems.”
Seagrass observations were made in the following systems this season:
- 456 observations taken in the Peel-Harvey estuary in March (plus drone footage)
- 270 observations taken in the Leschenault Estuary in February
- 200 observations taken in the Wilson Inlet in December
- 208 observations taken in the Oyster Harbour in January
- 217 observations taken in the Princess Royal Harbour in January
Results from this year’s seagrass mapping are expected to be analysed by early 2022. Results from the 2017-20 monitoring period are available online.
Find out more about seagrasses in our estuaries.
Read about how we used drones in the Peel-Harvey to help map seagrass.
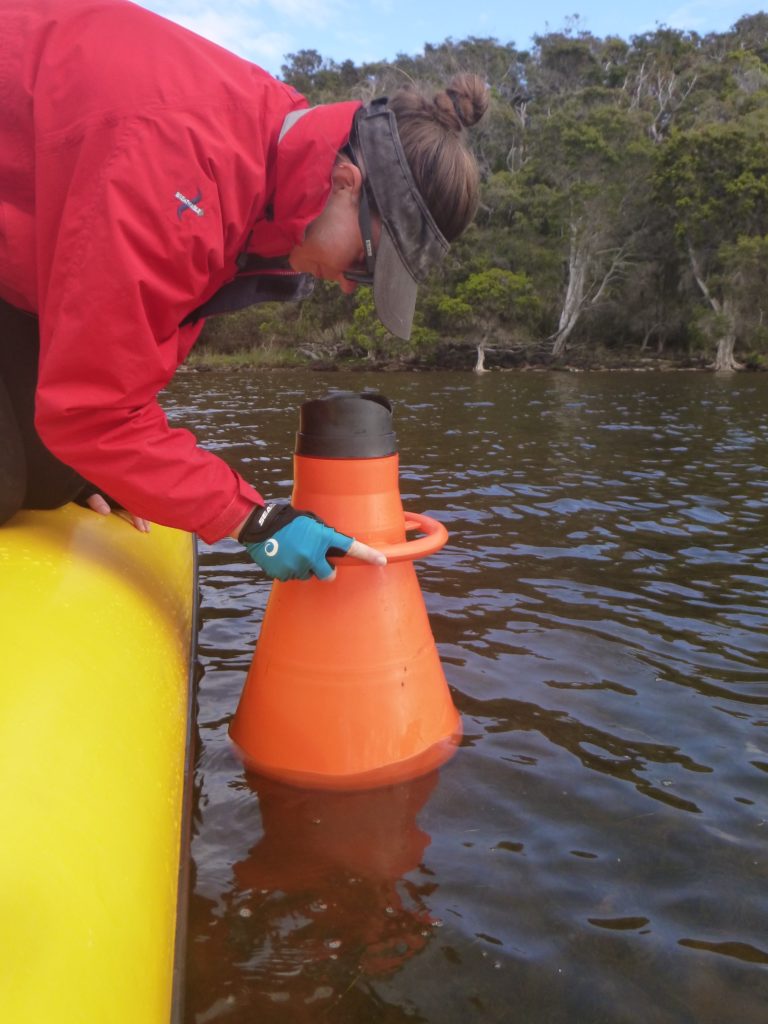
Department scientist using a viewing cone to take observations of seagrass