Wilson Inlet - Physical profiles
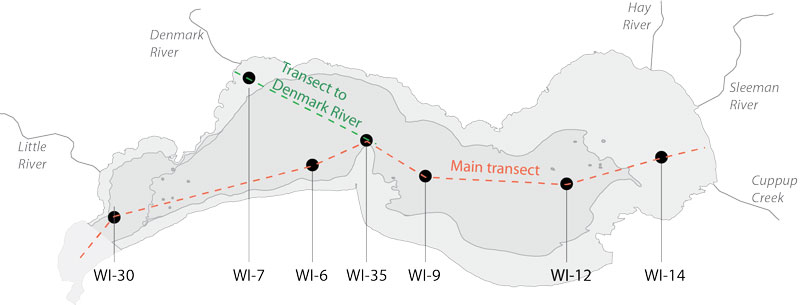
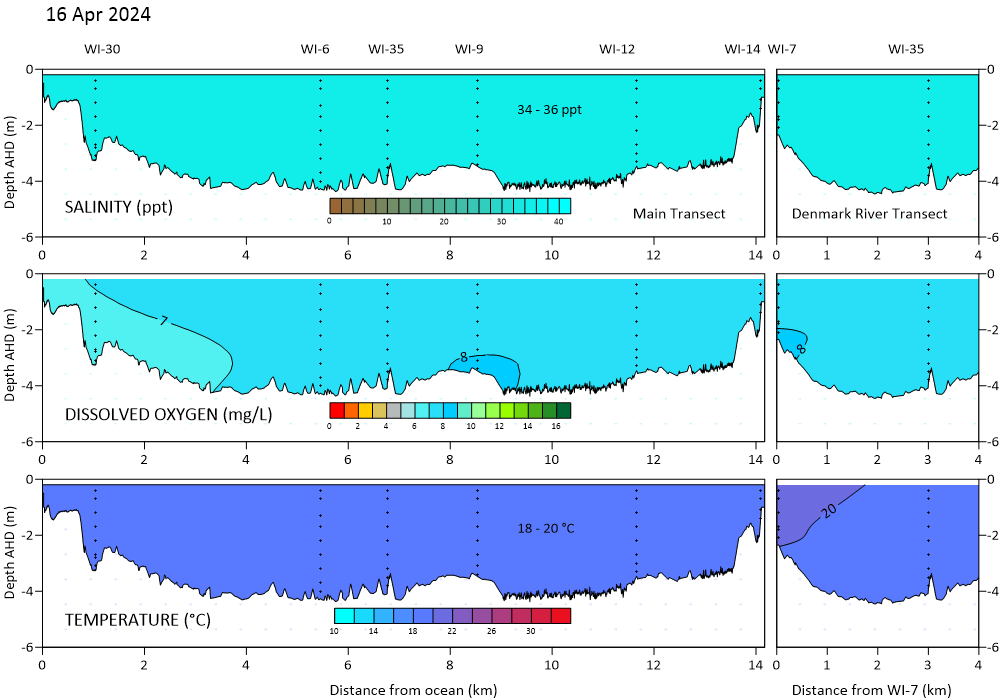
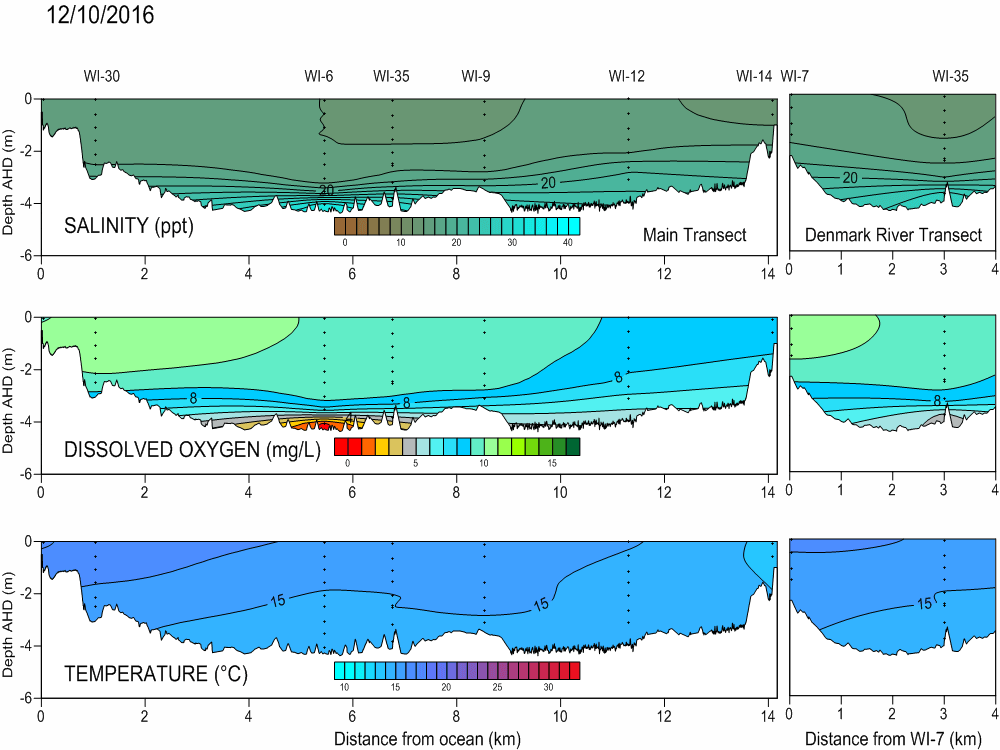
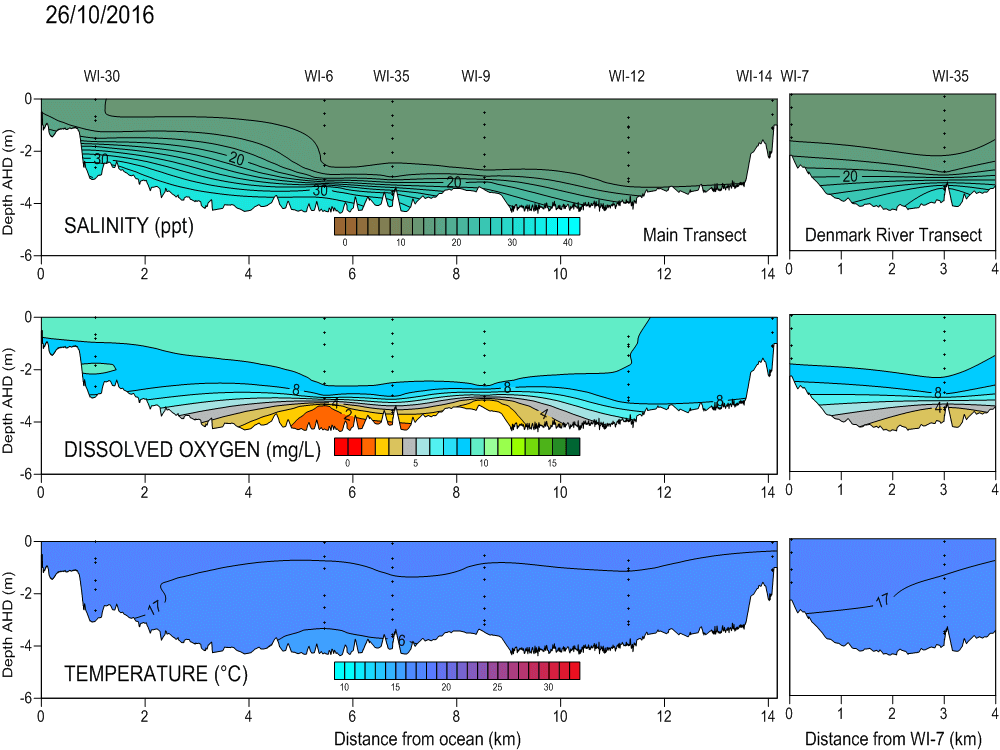
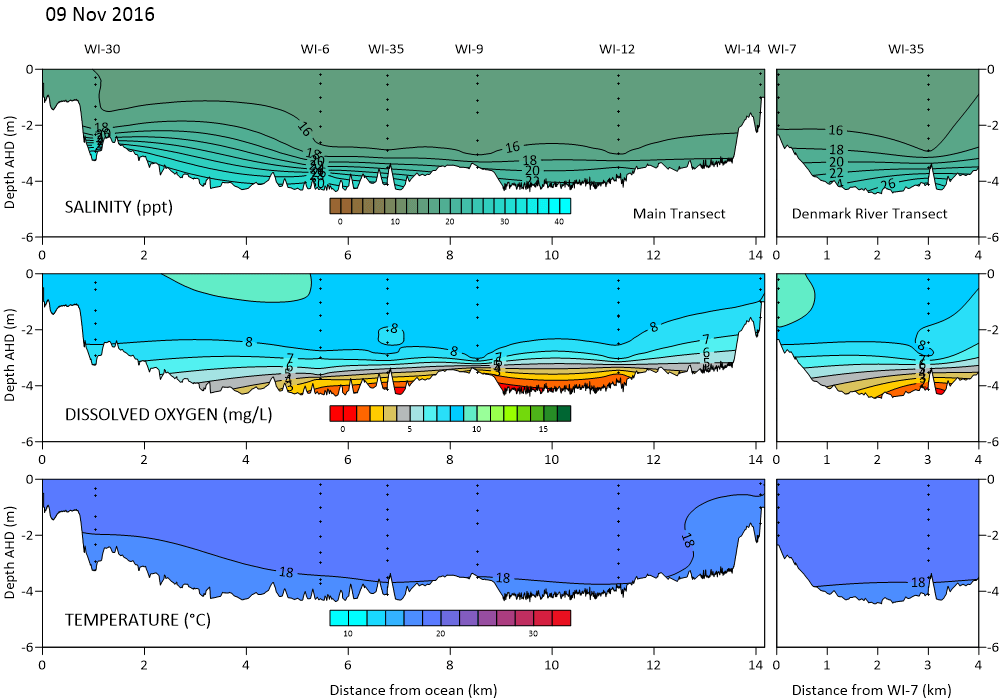
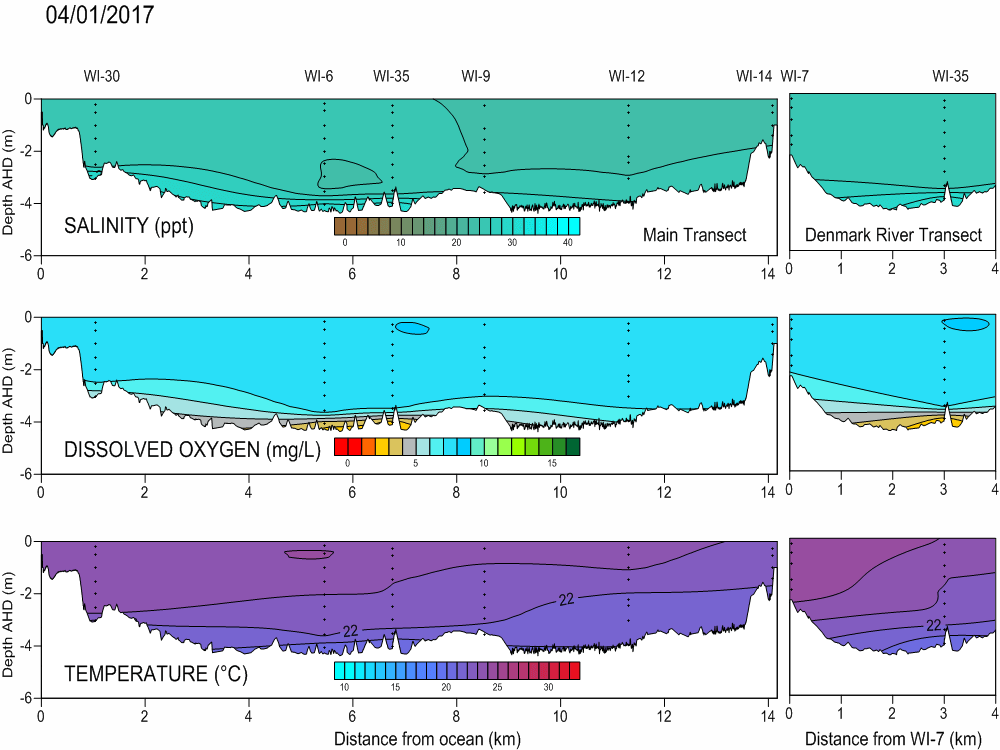
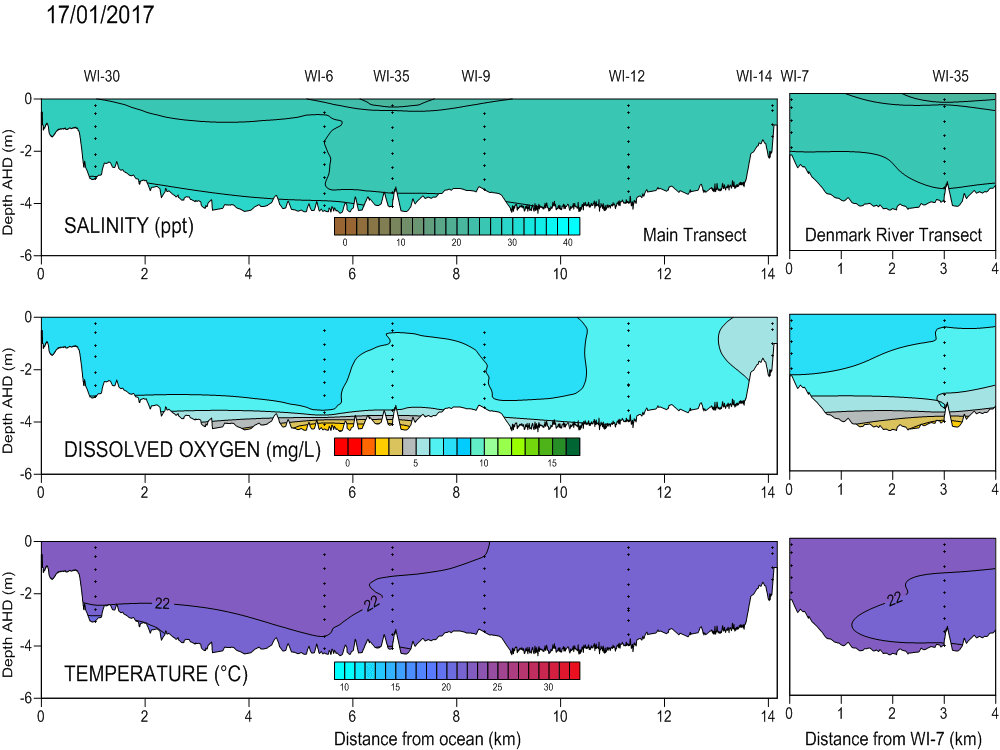
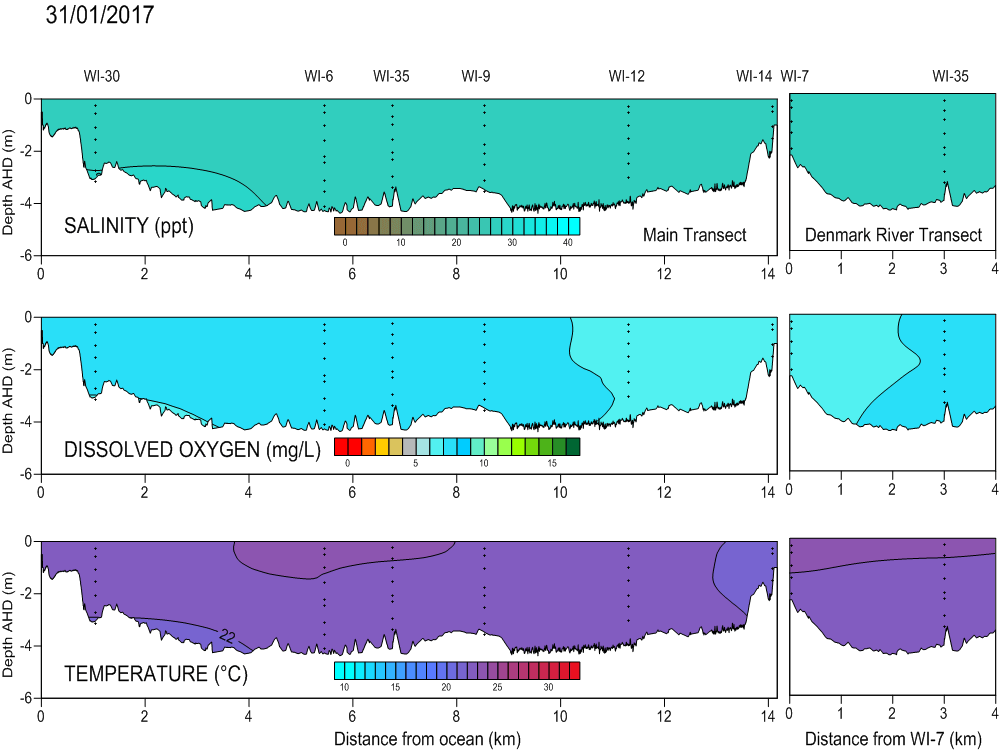
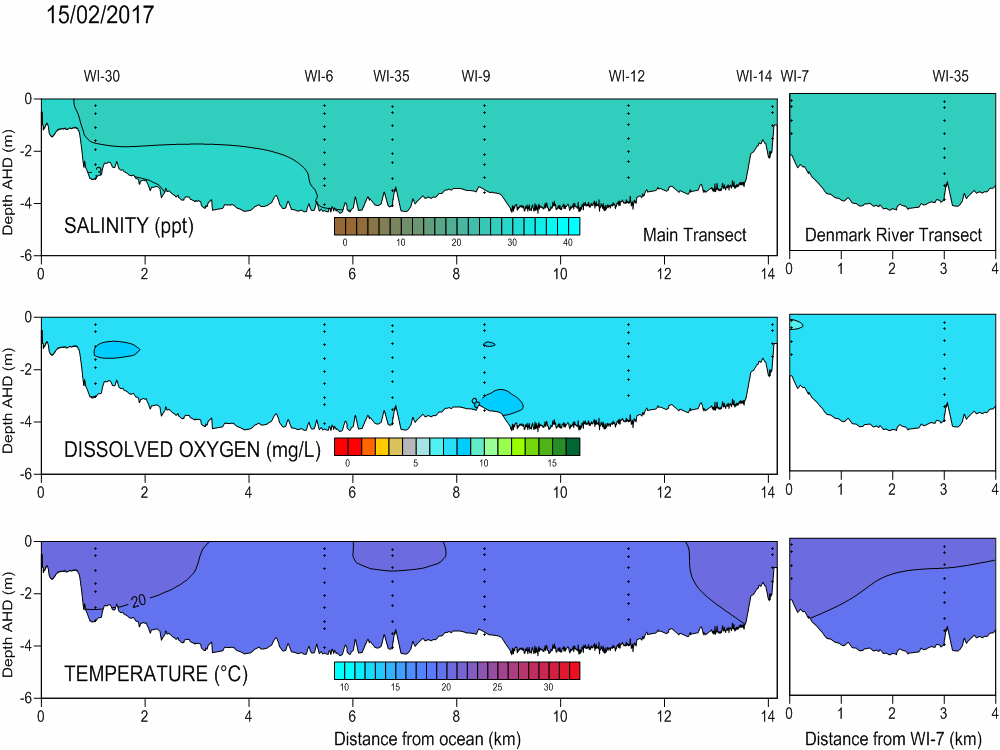
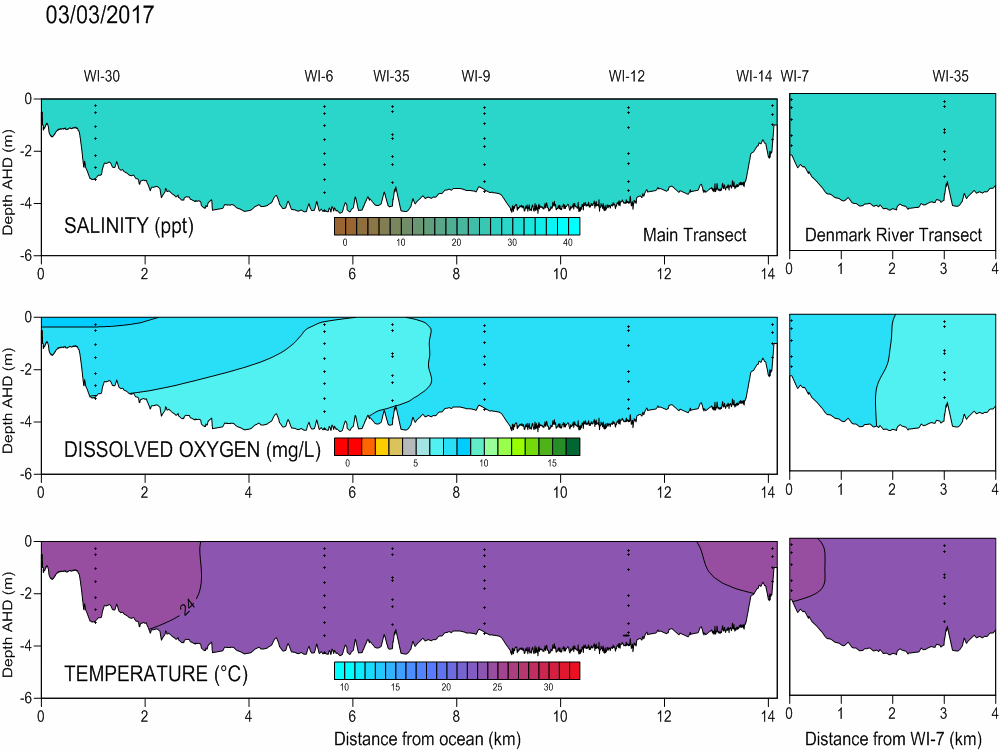
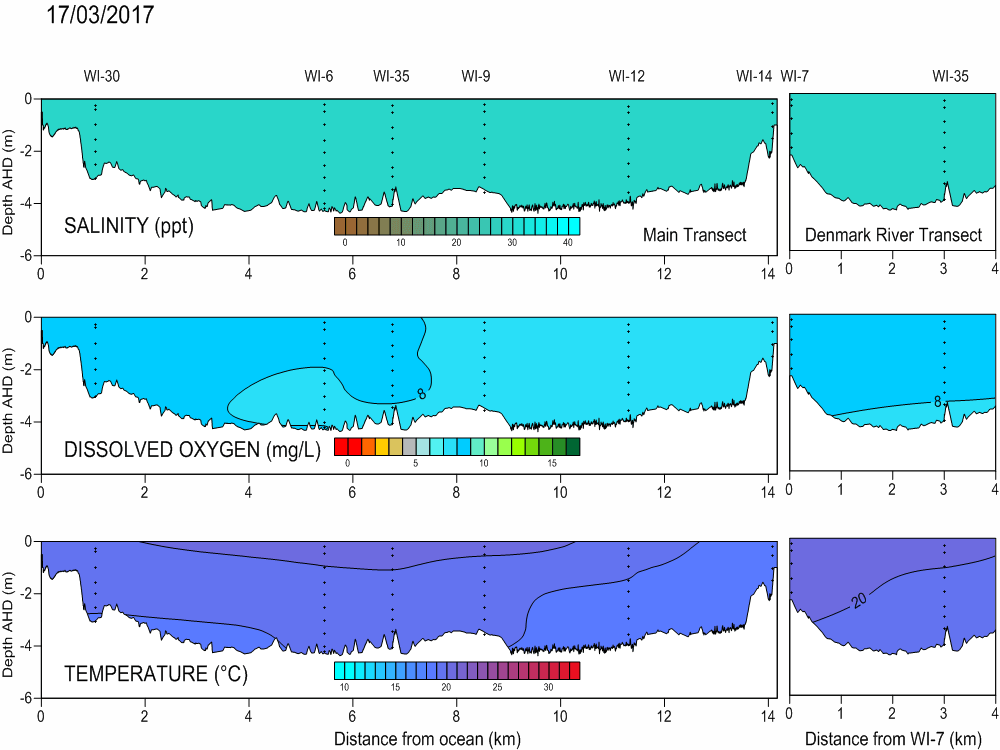
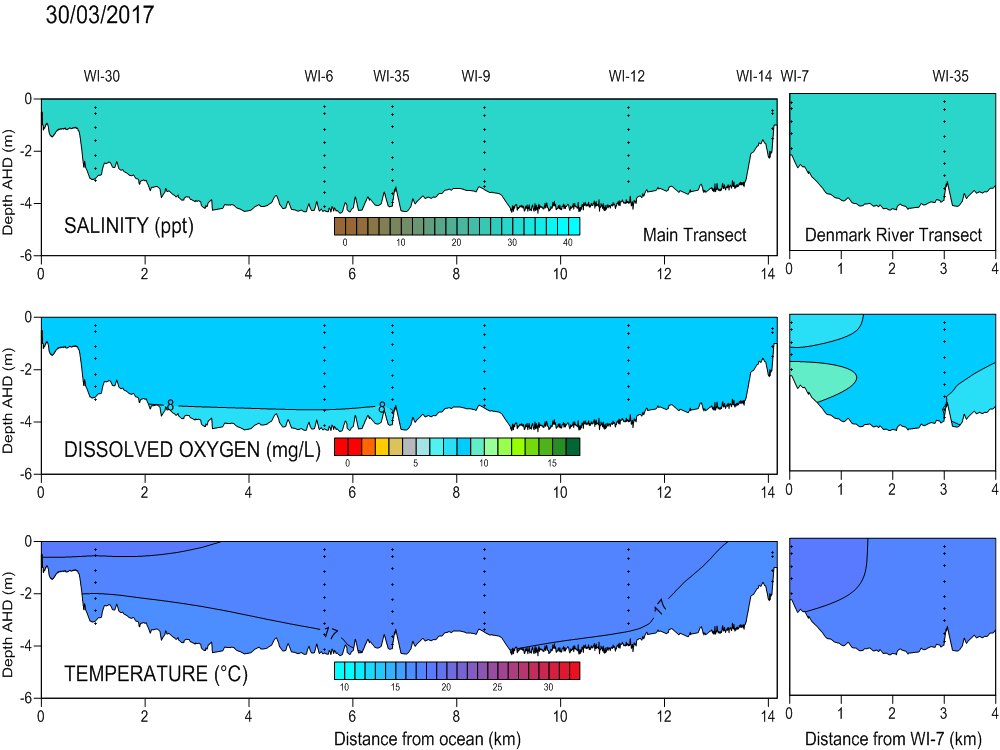
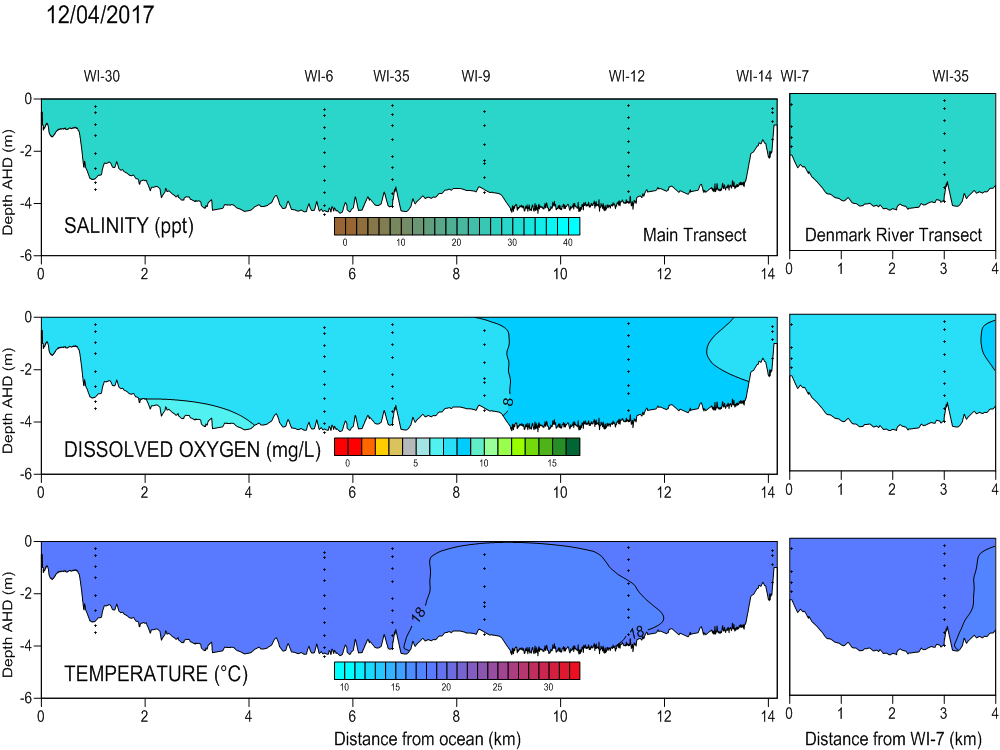
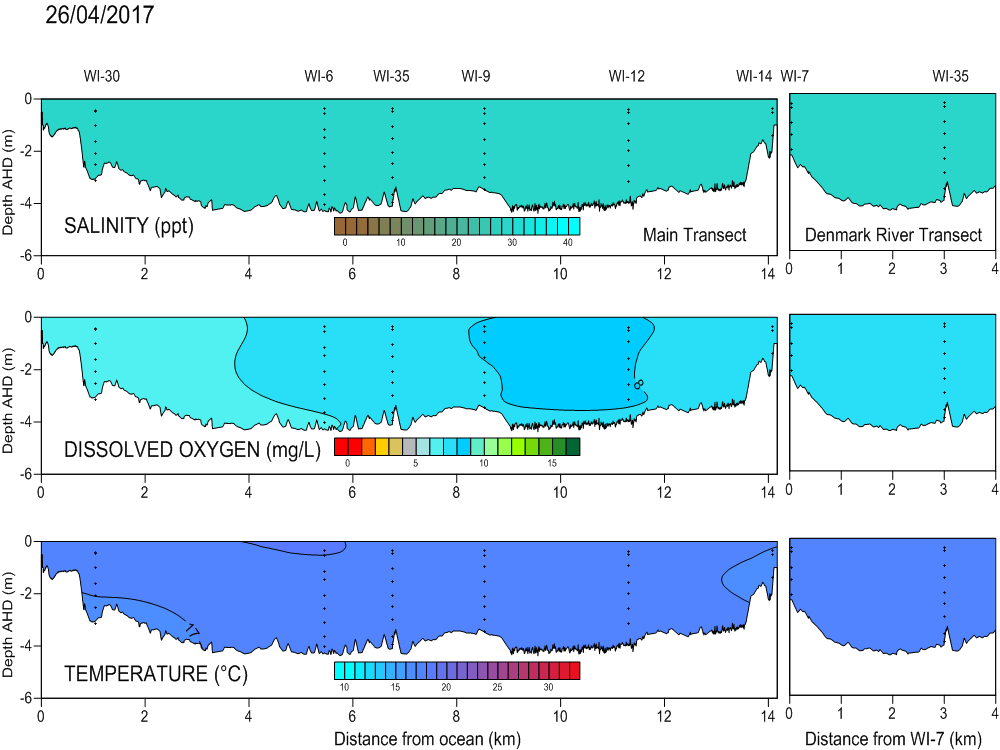
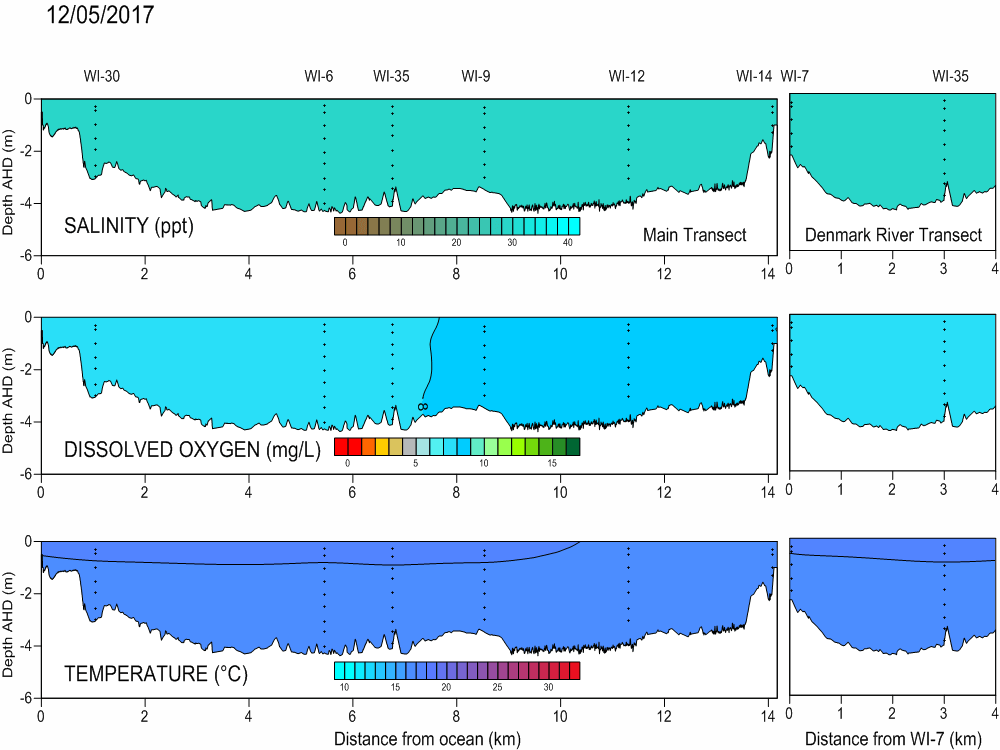
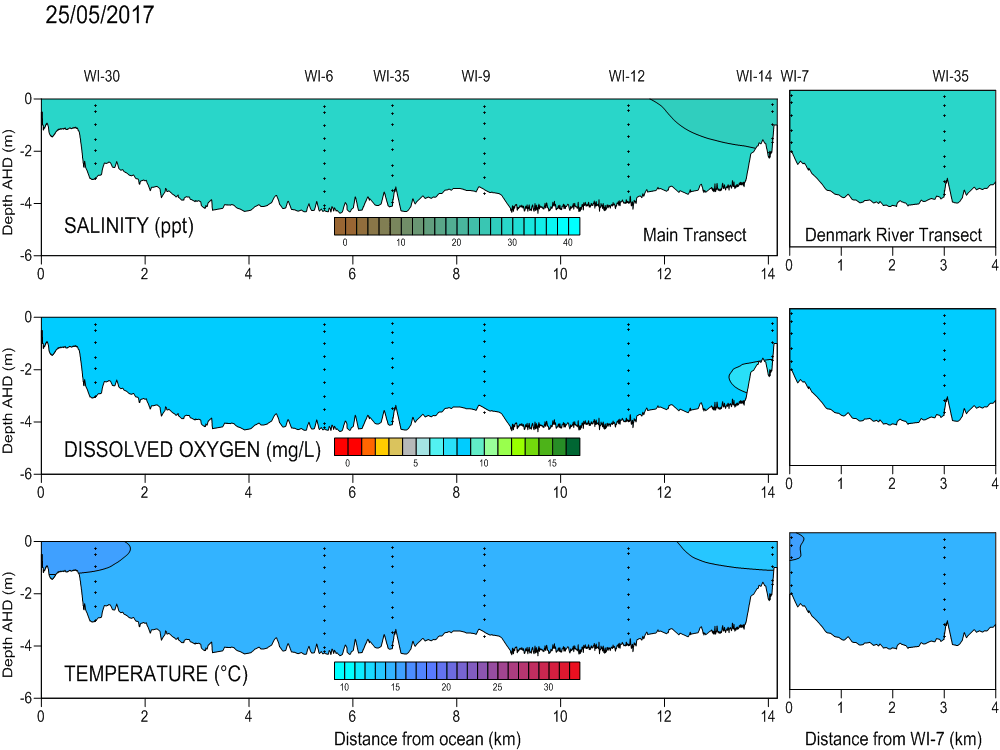
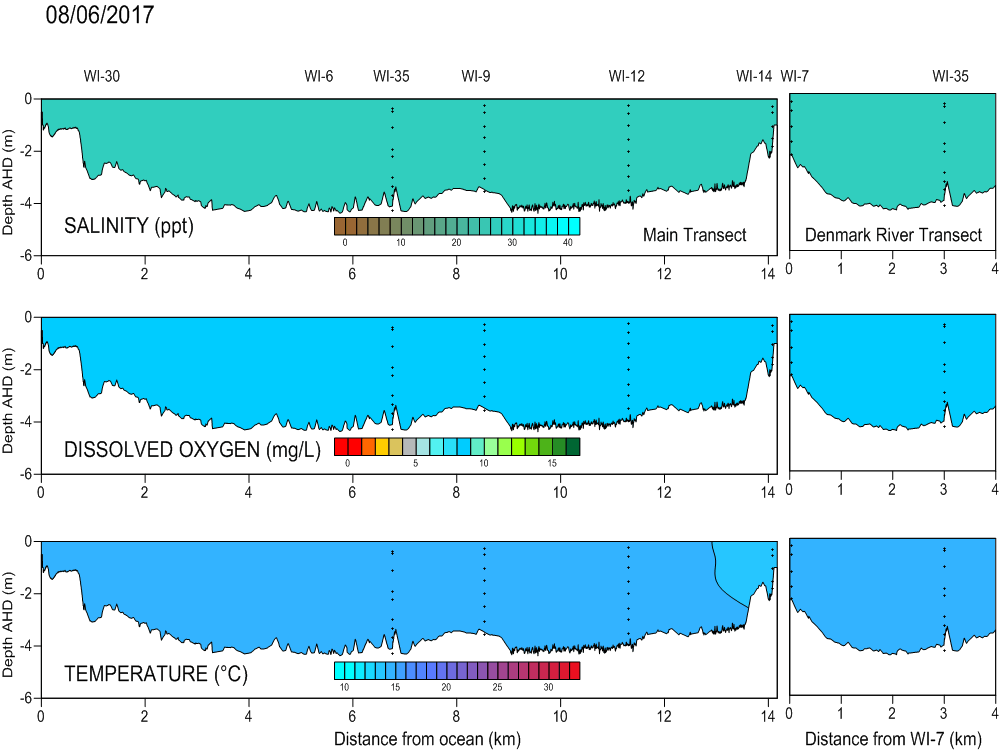
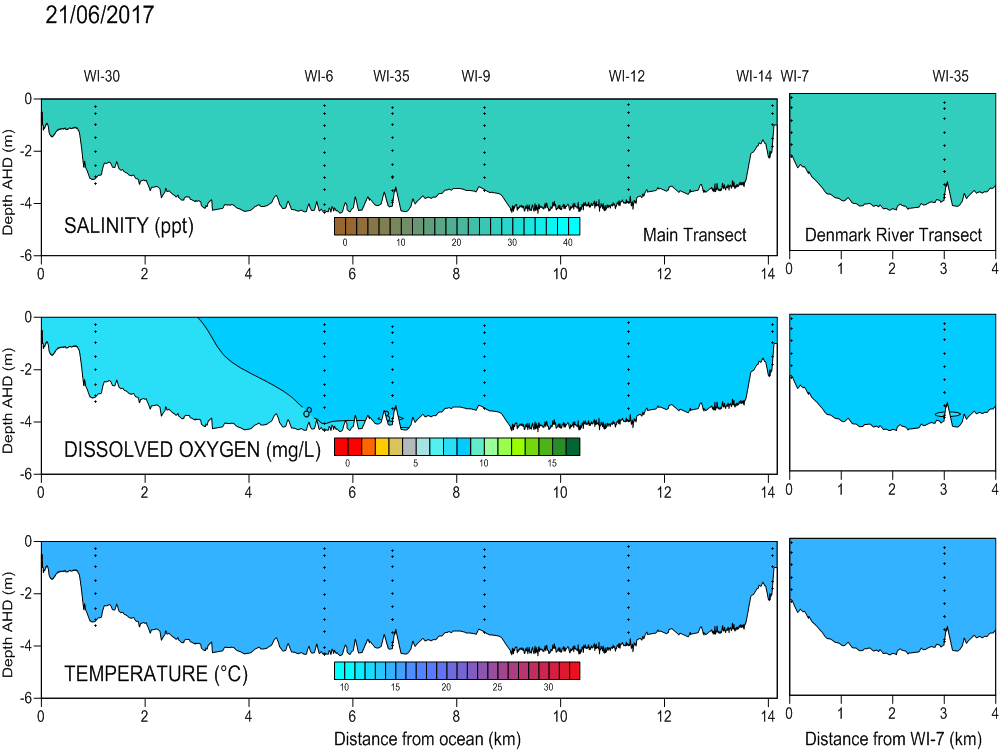
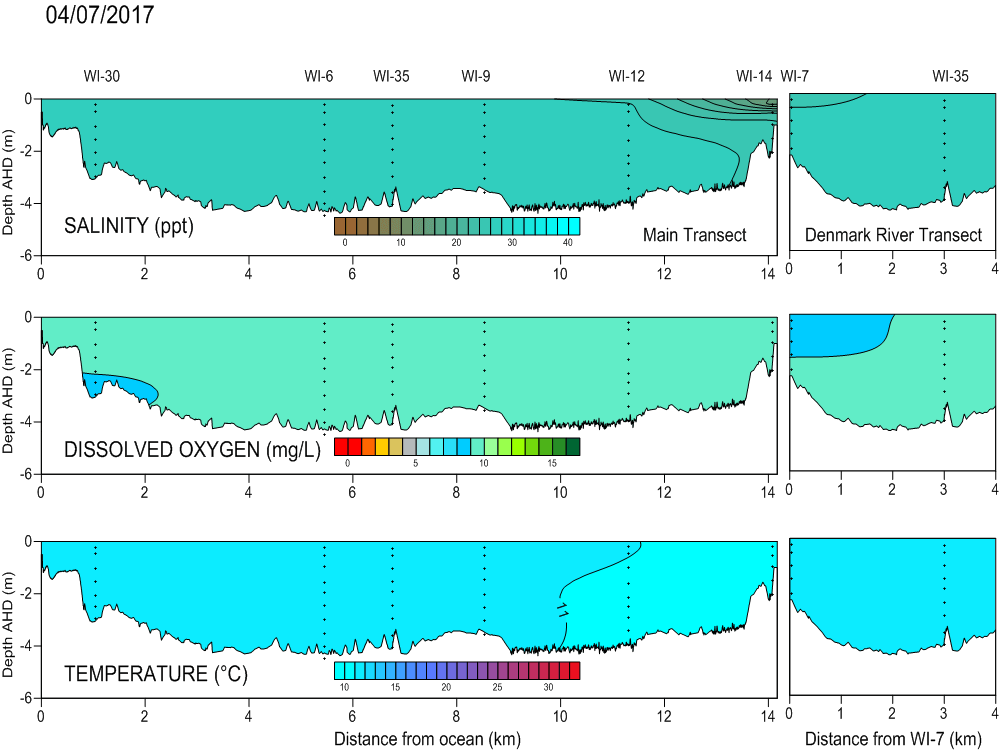
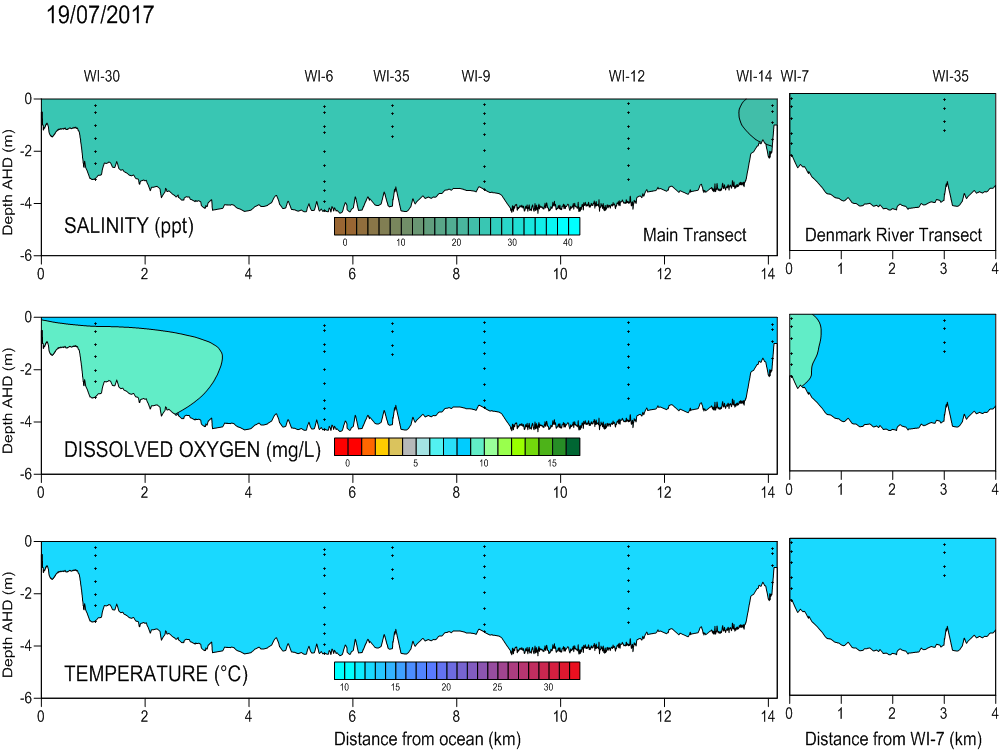
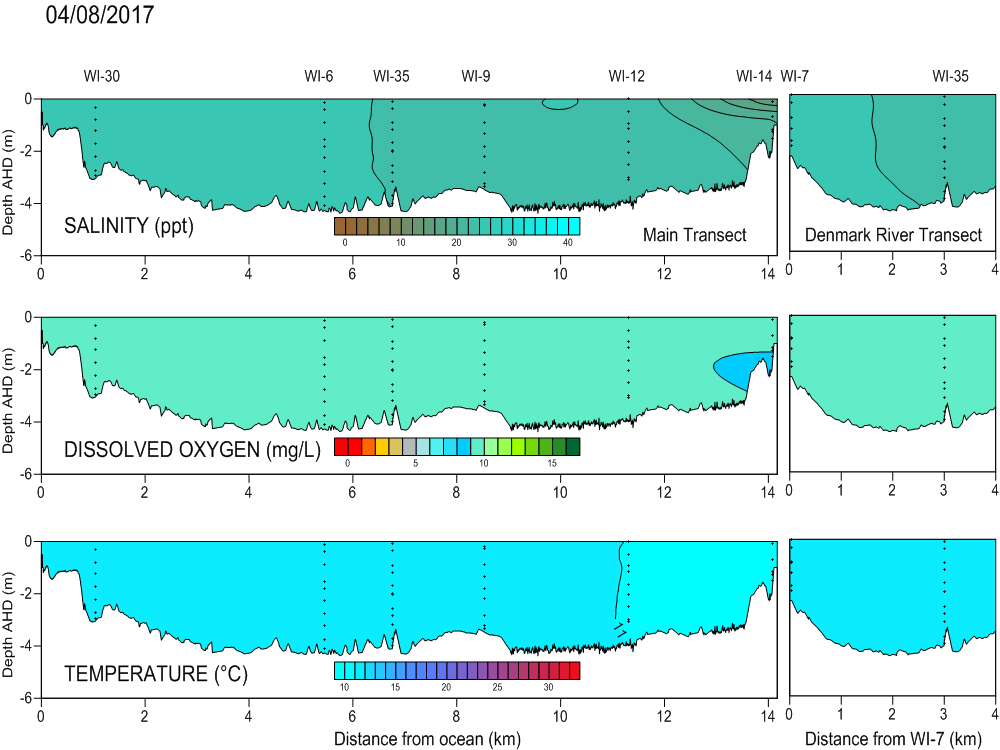
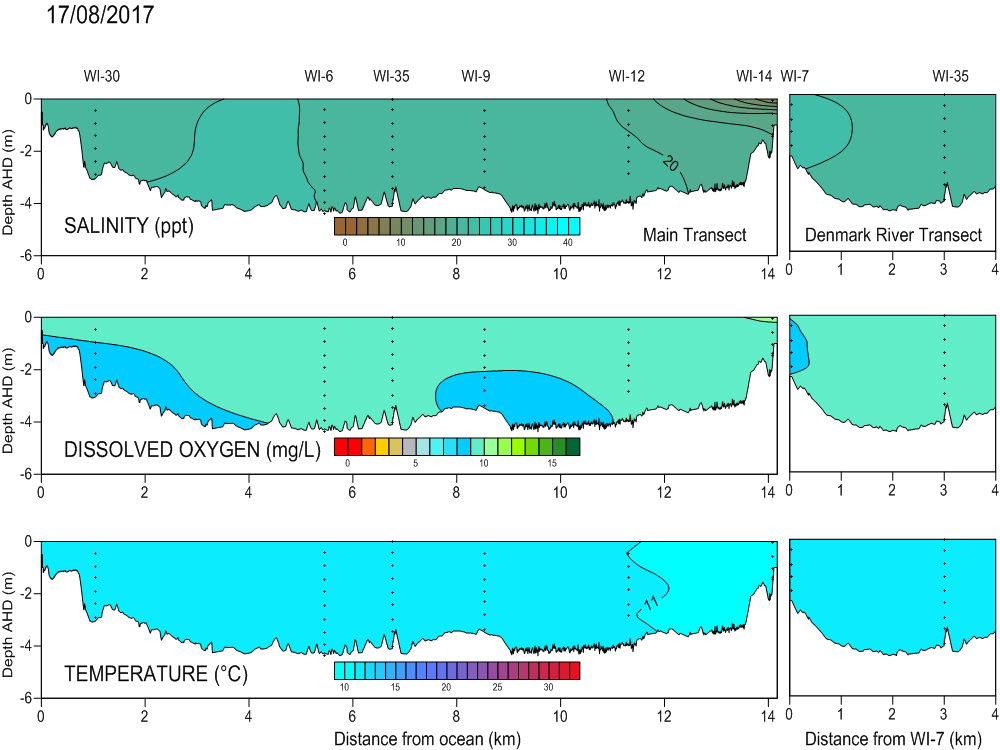
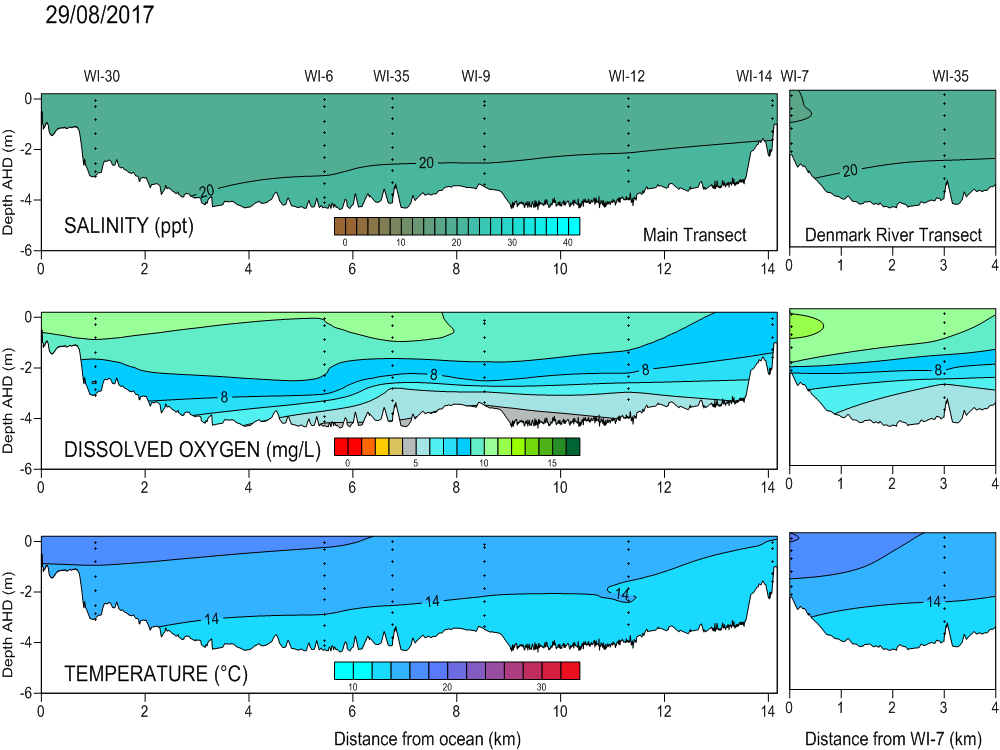
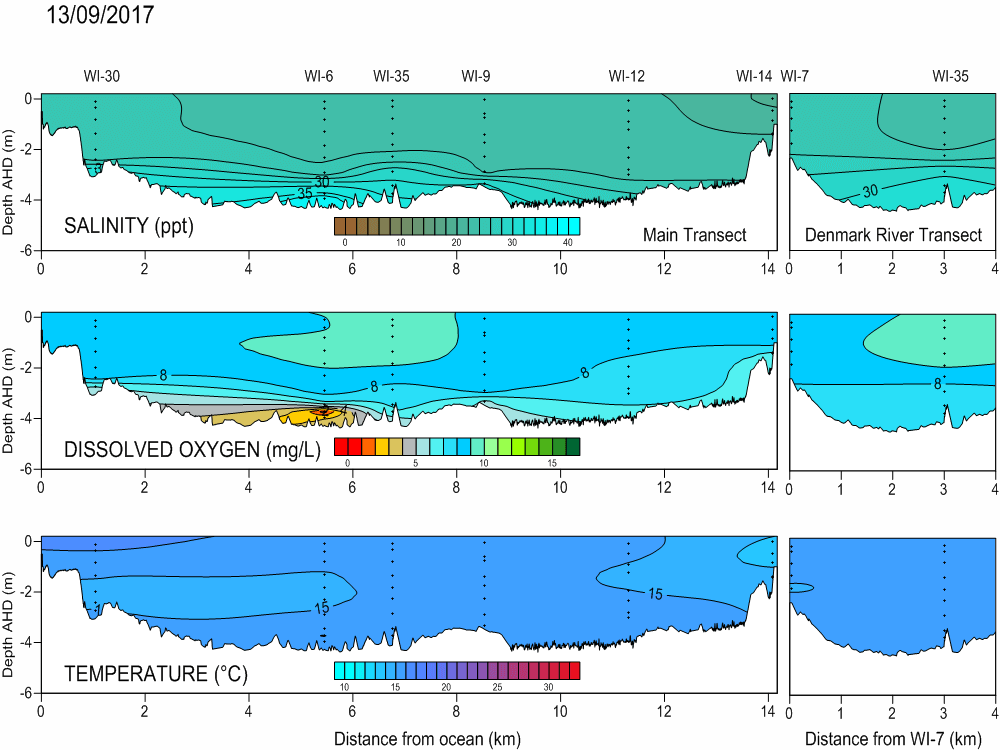
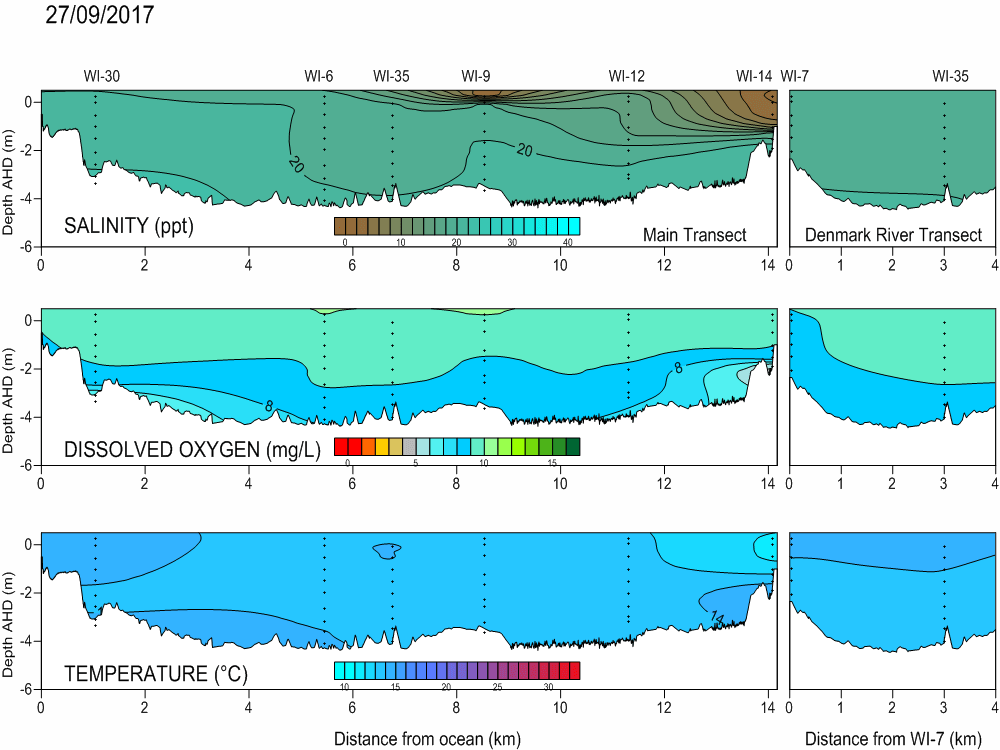
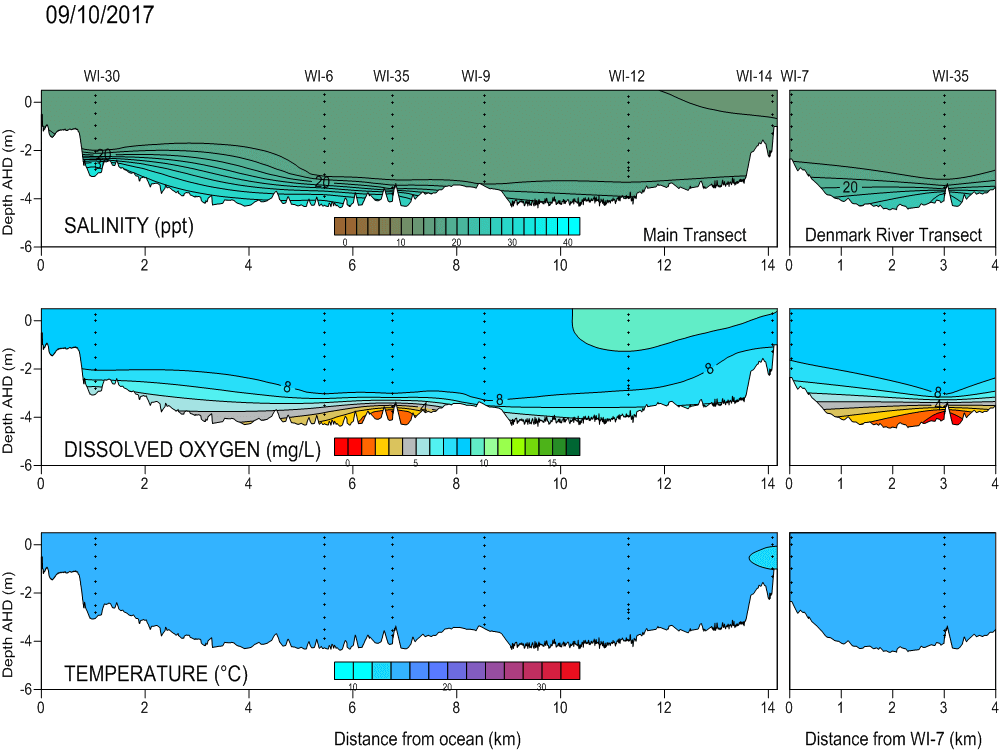
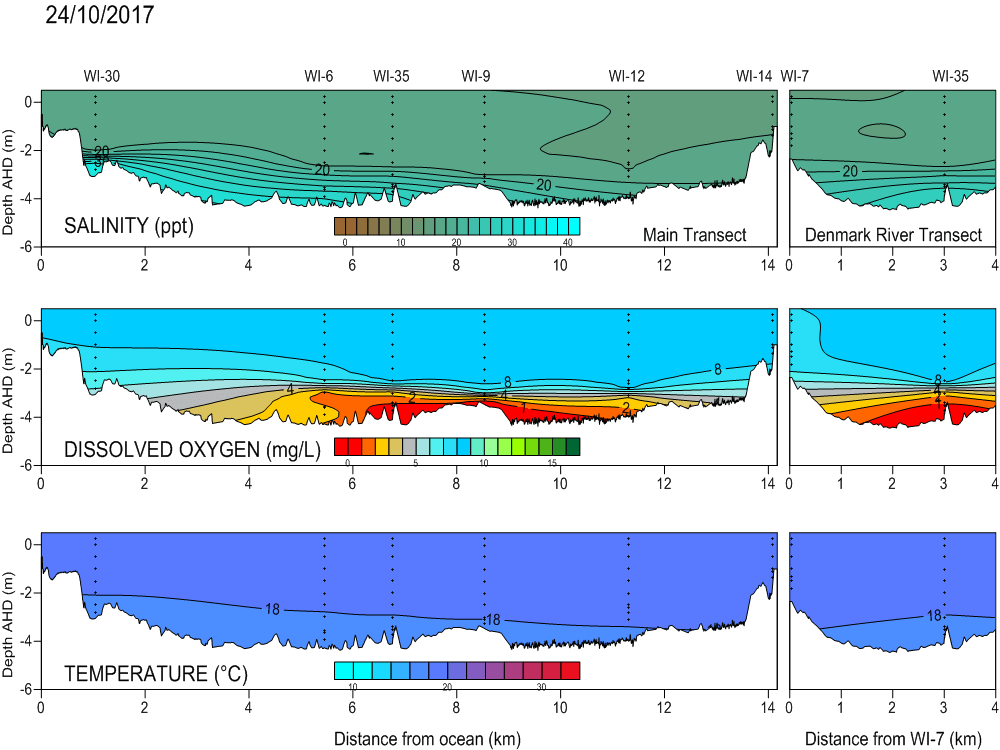
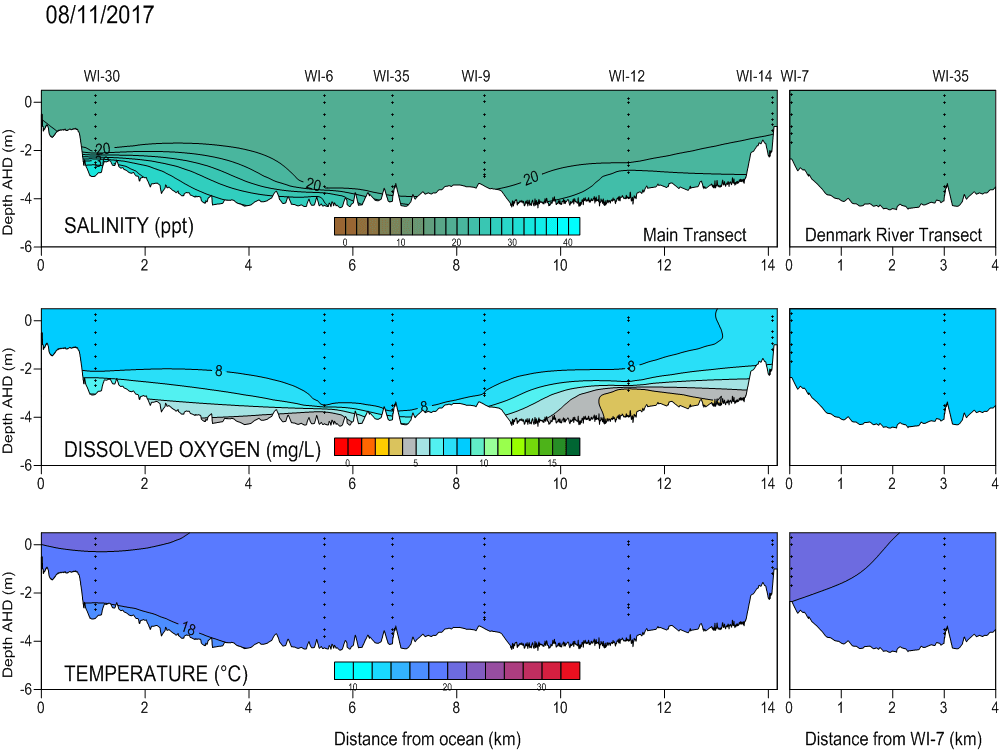
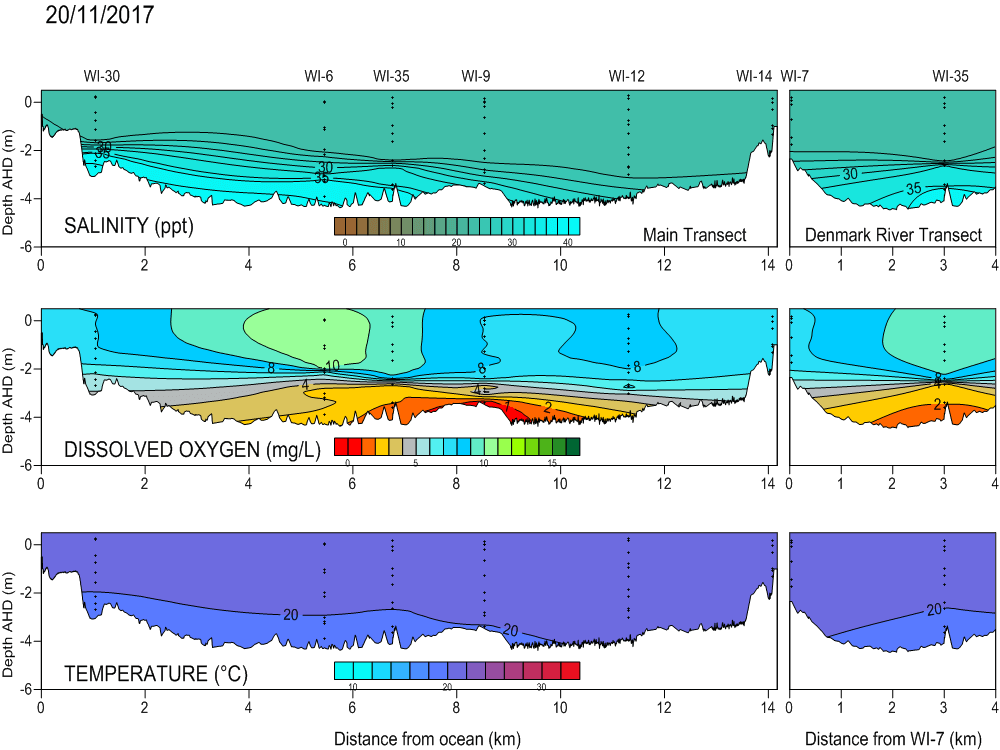
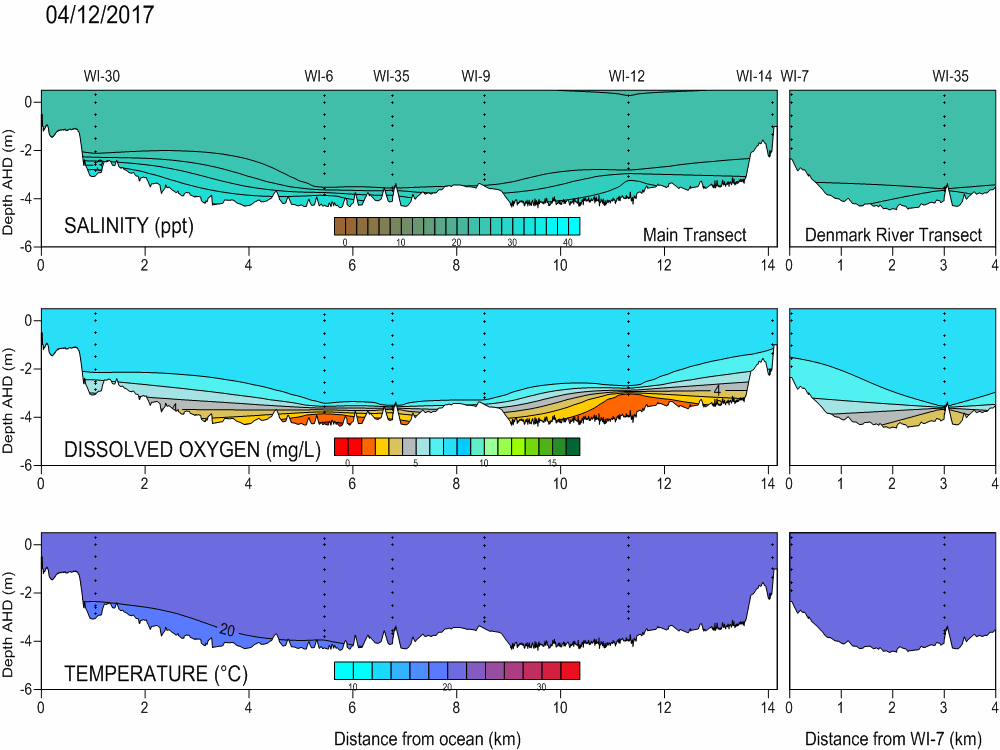
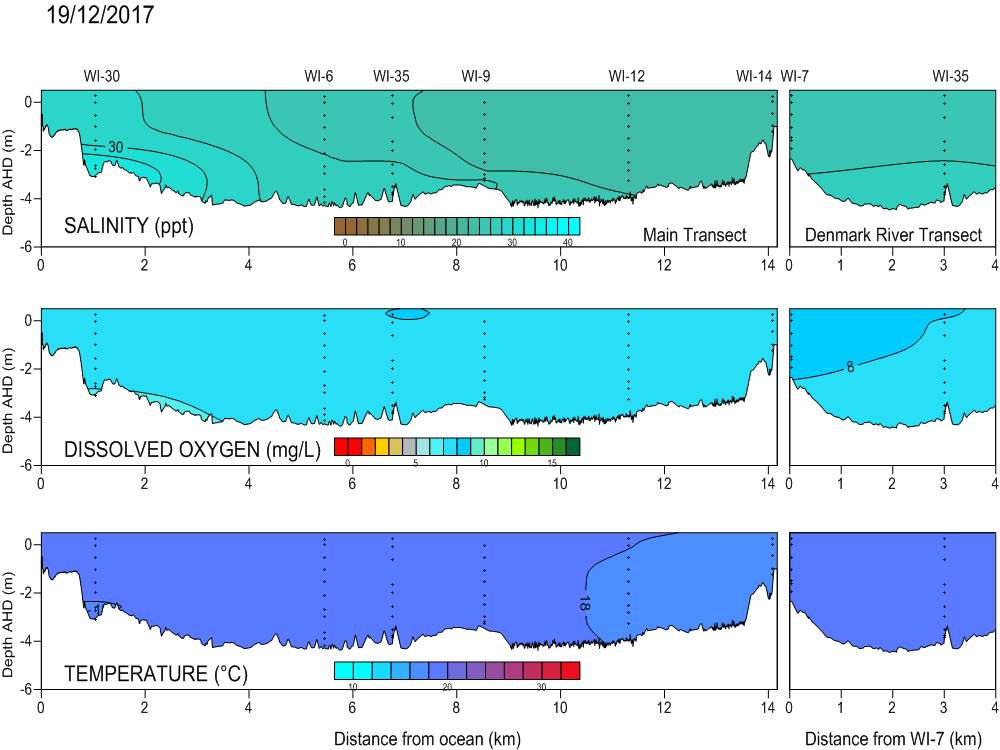
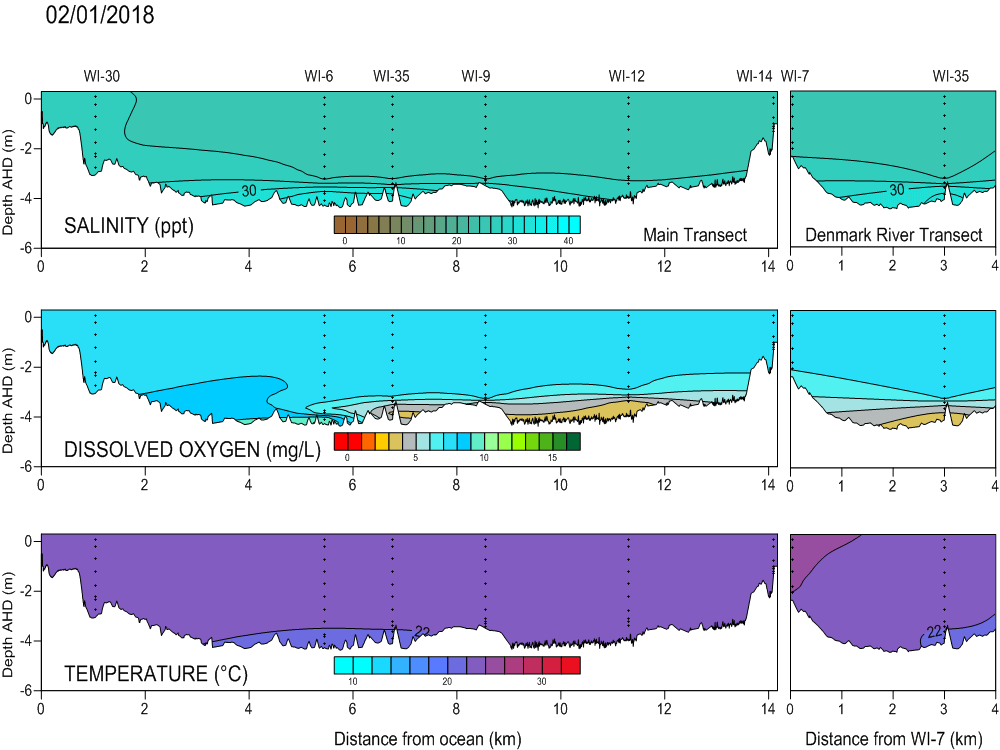
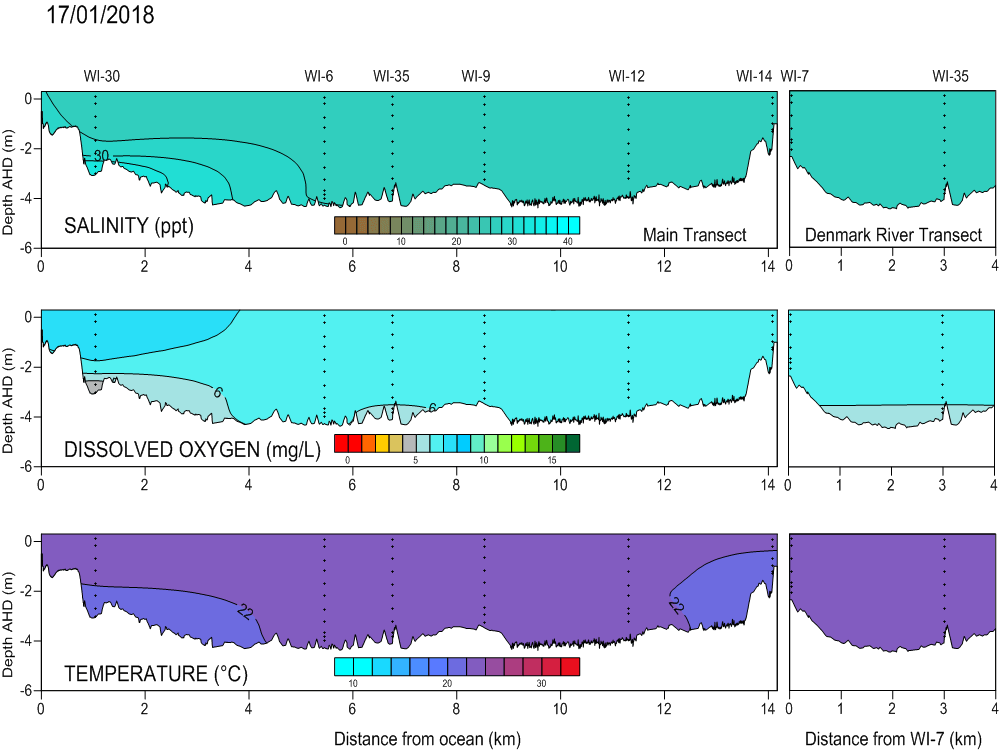
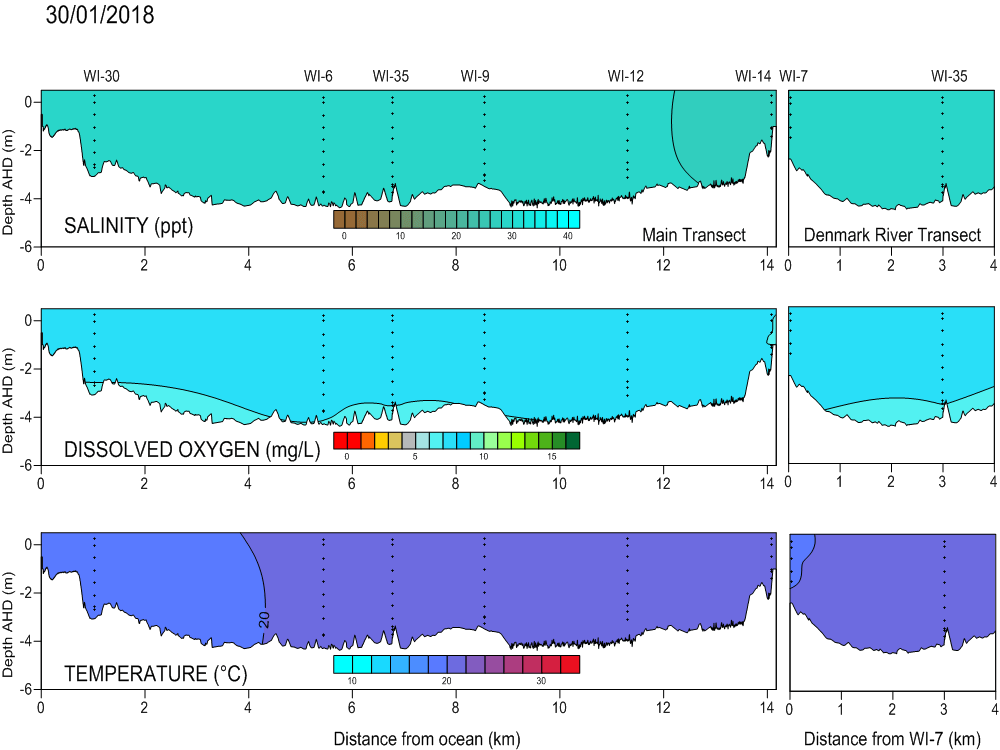
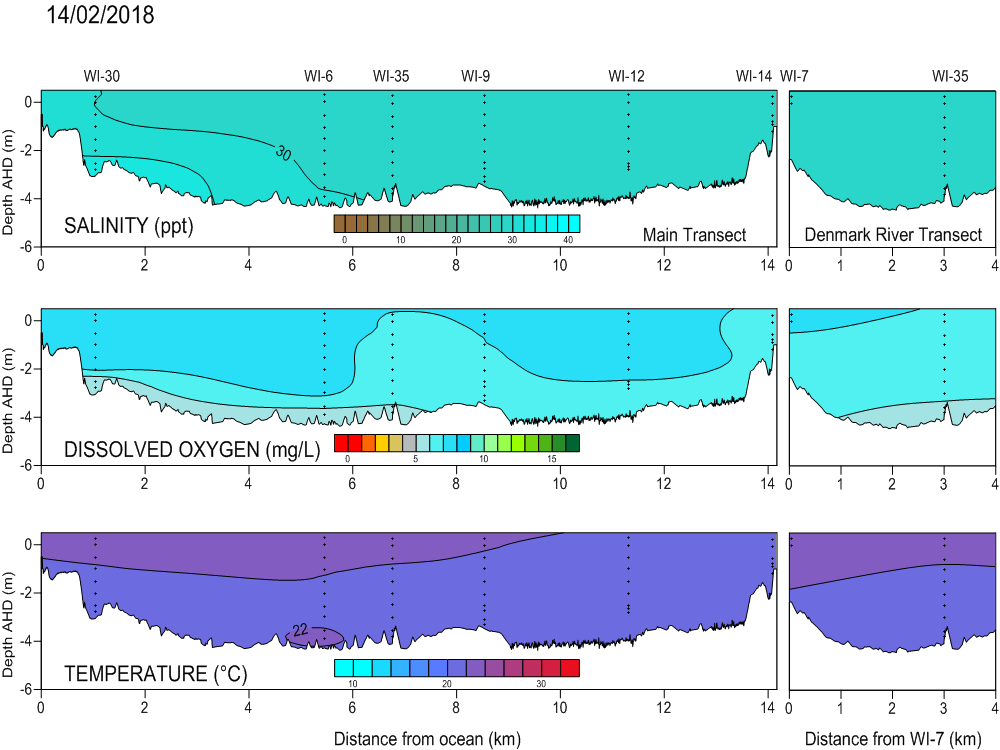
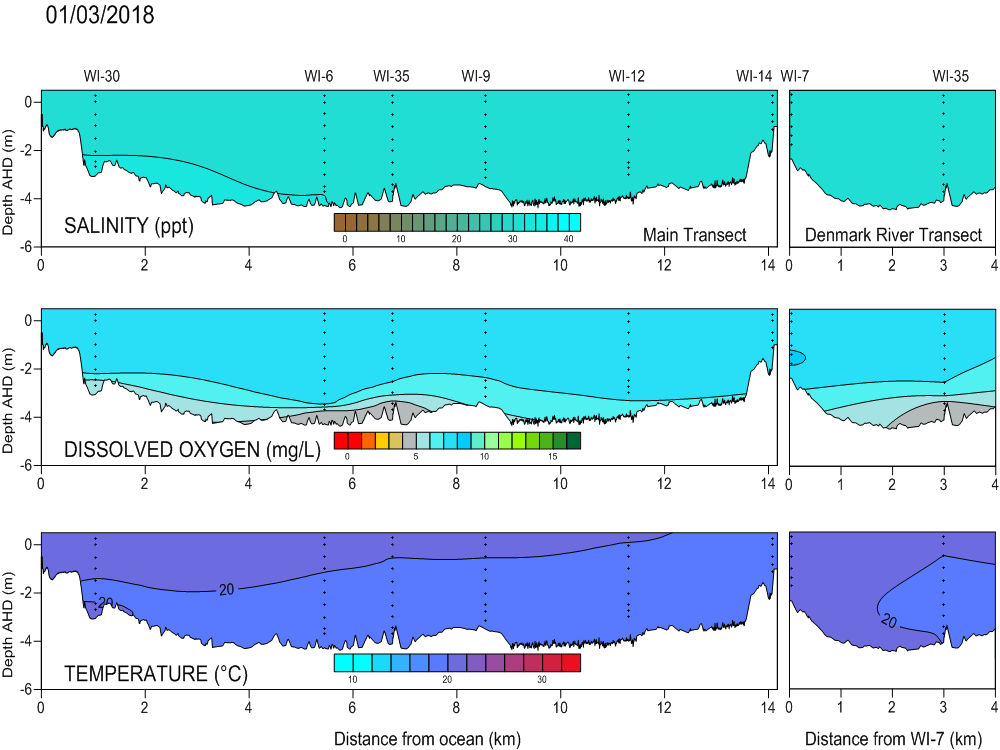
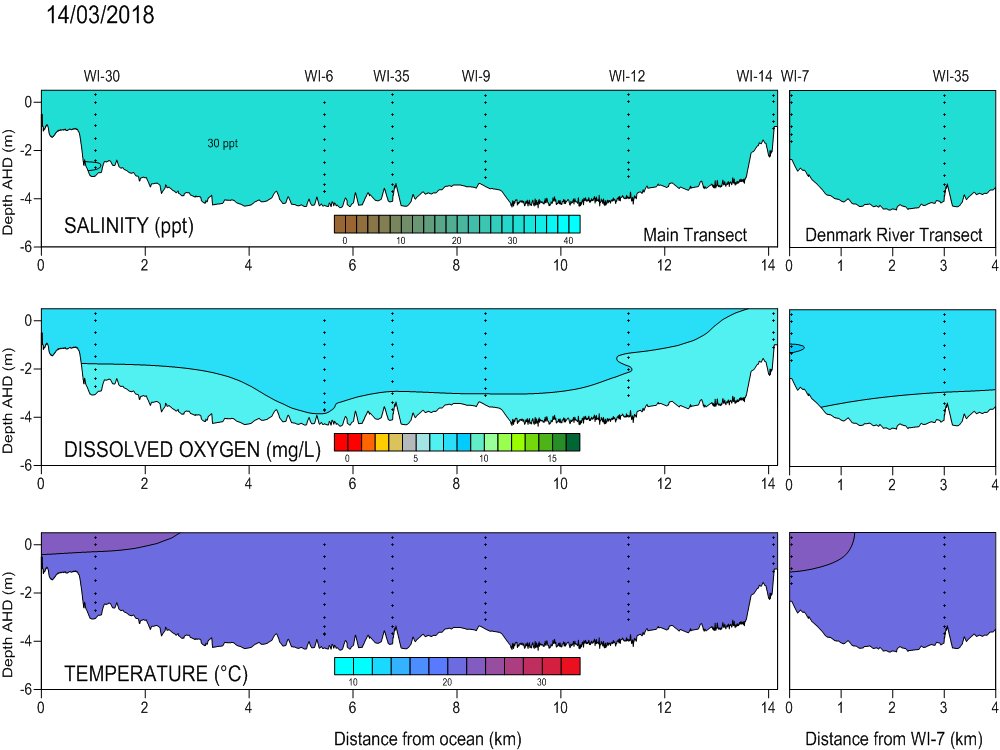
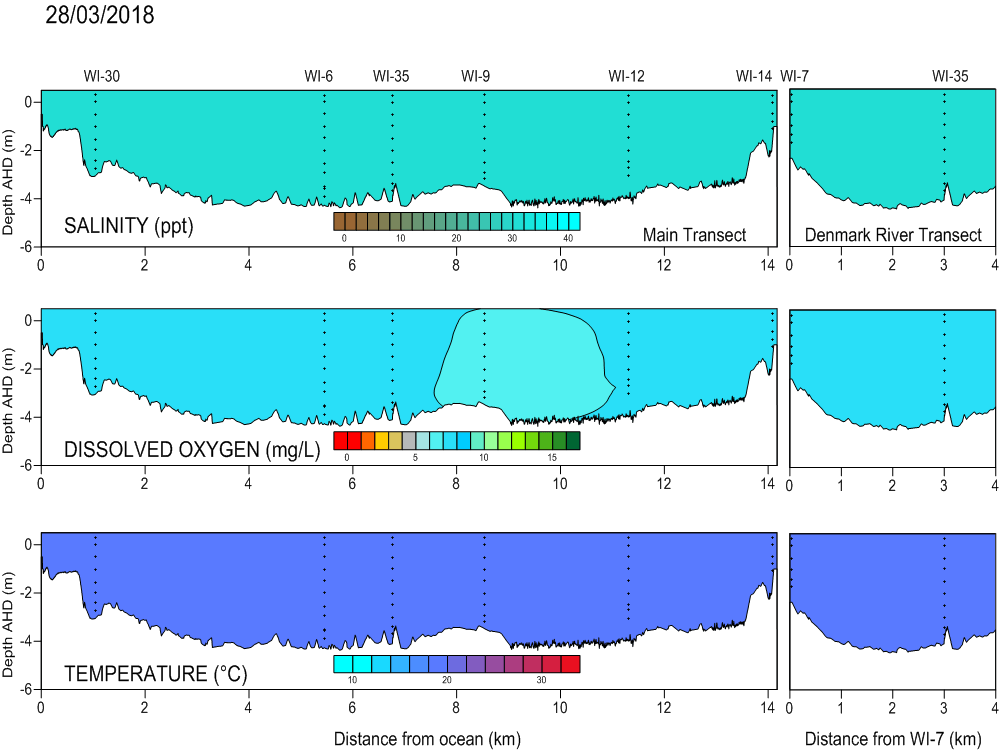
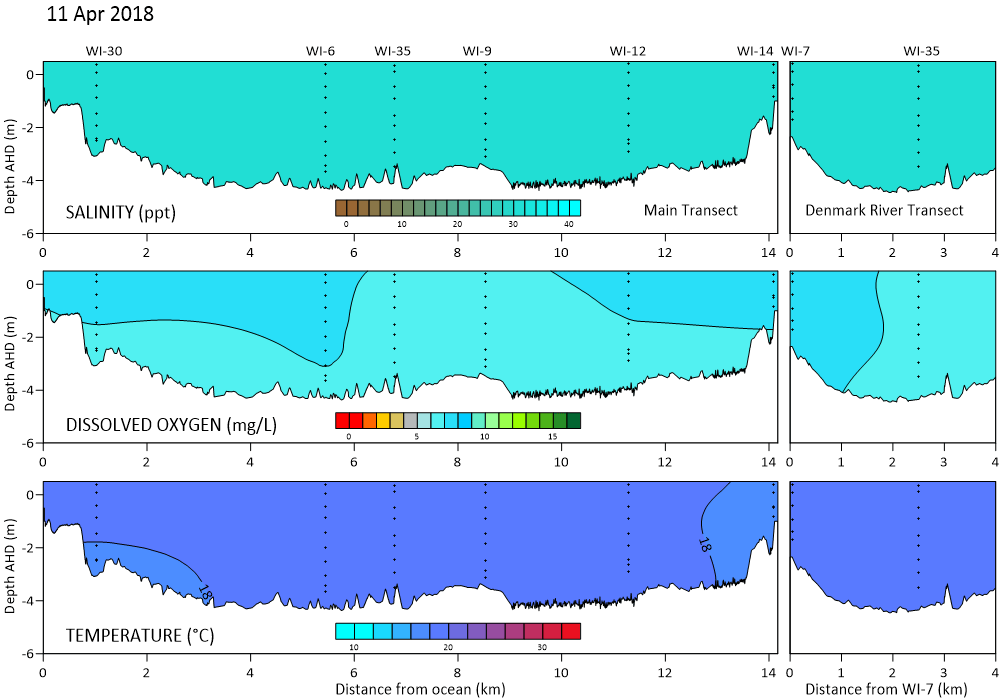
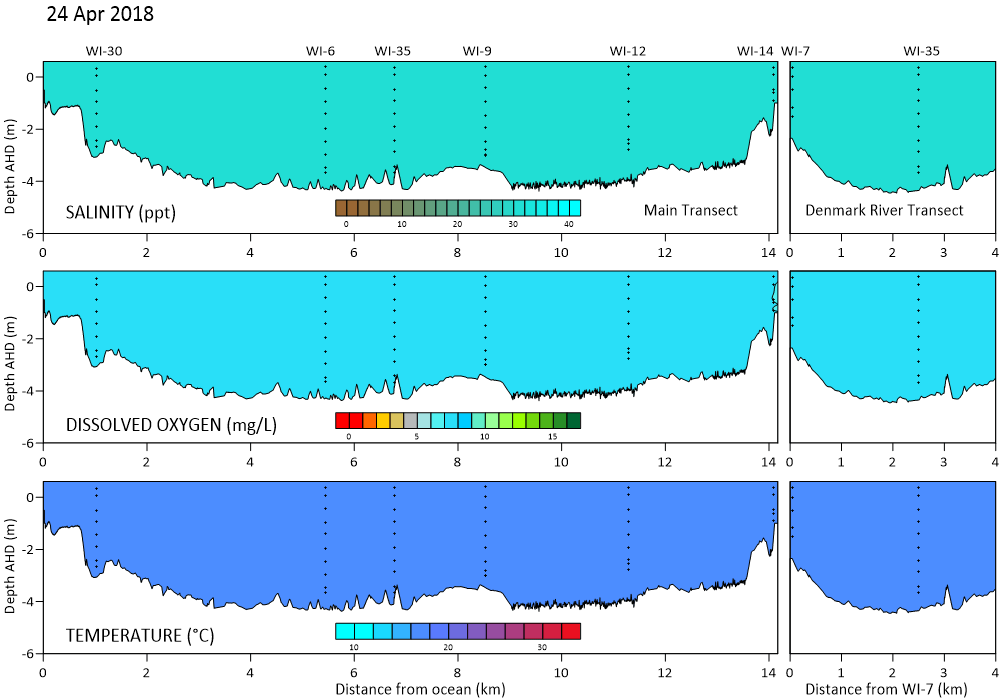
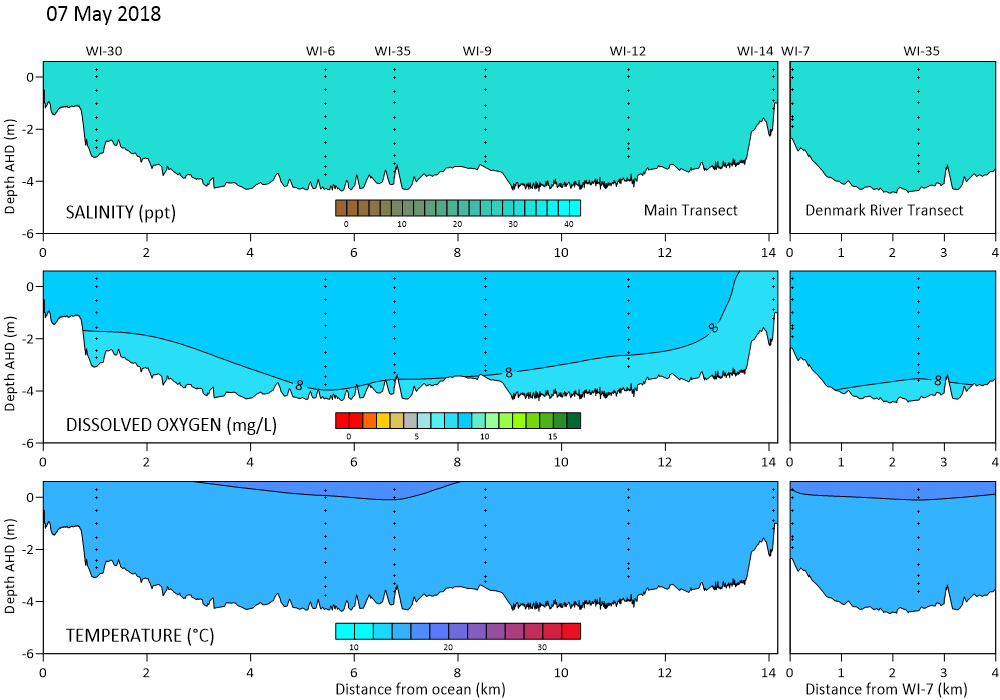
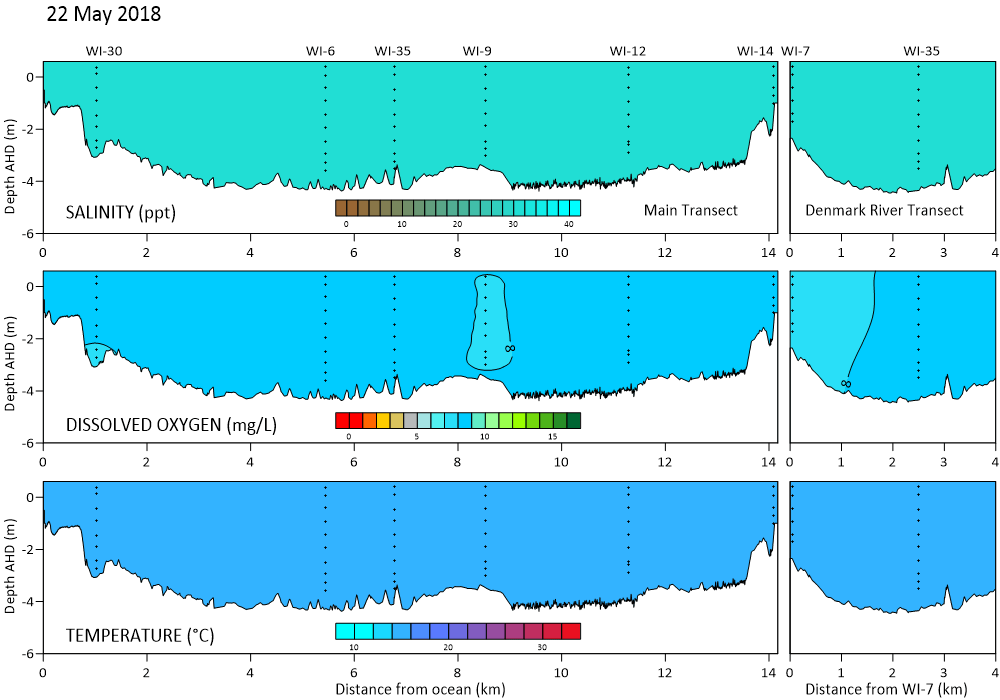
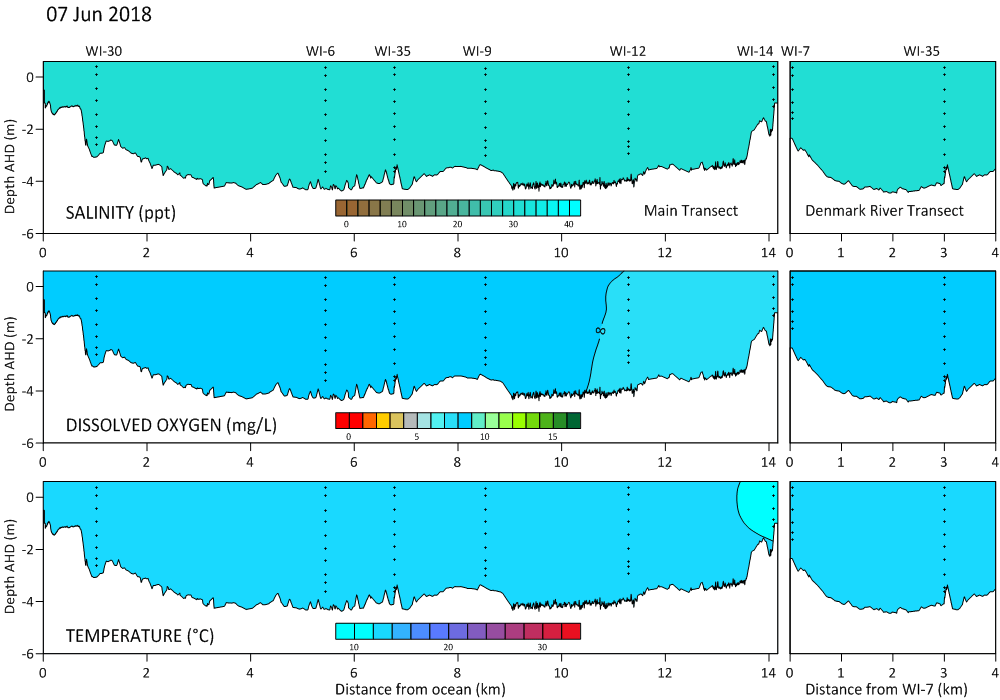
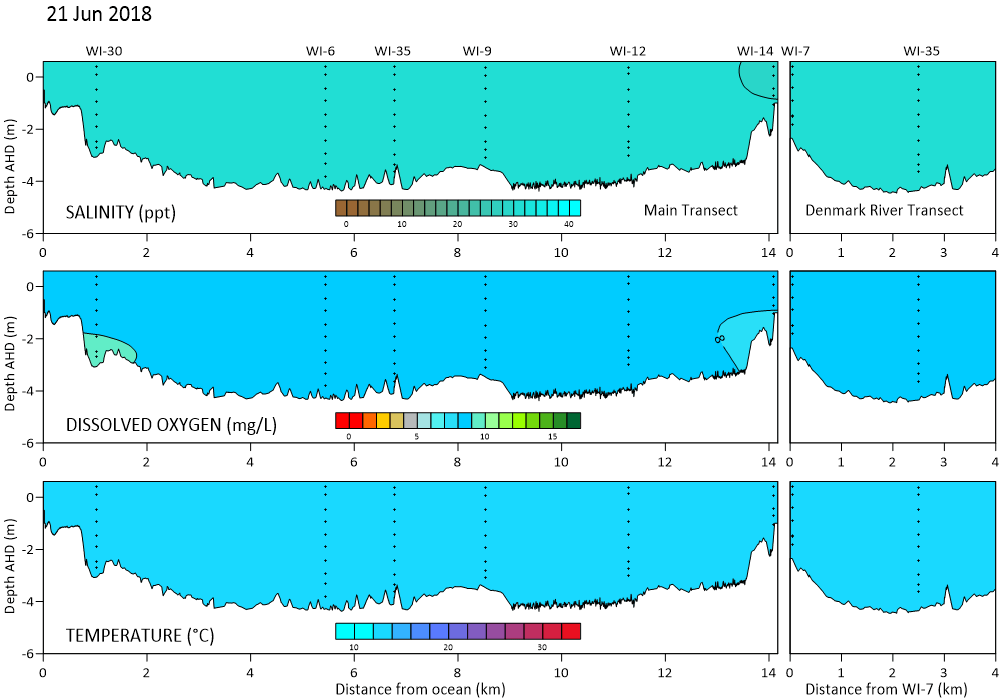
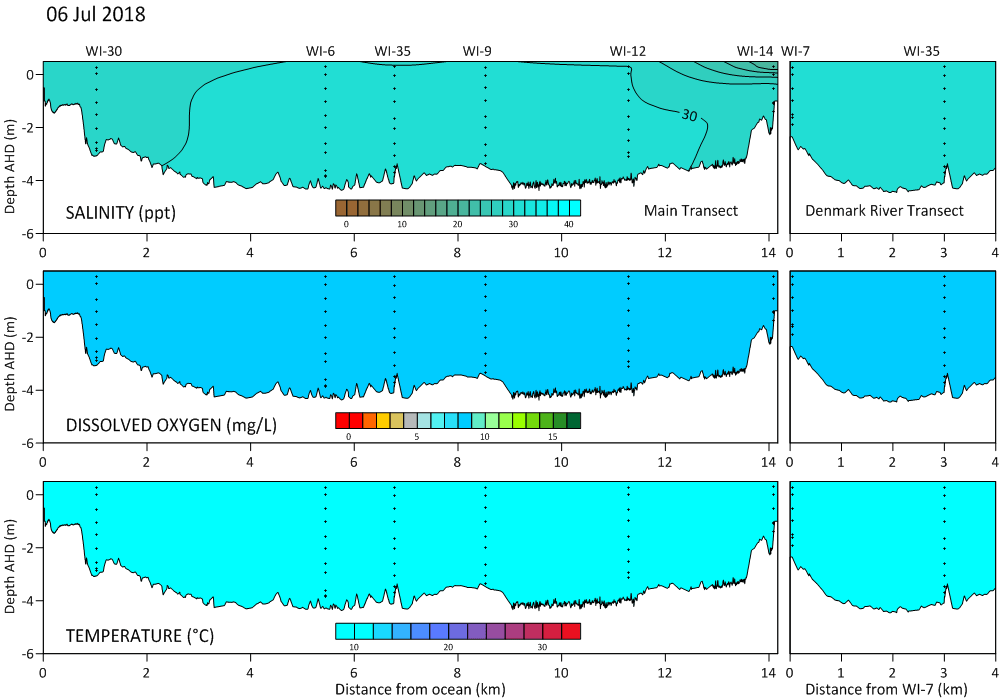
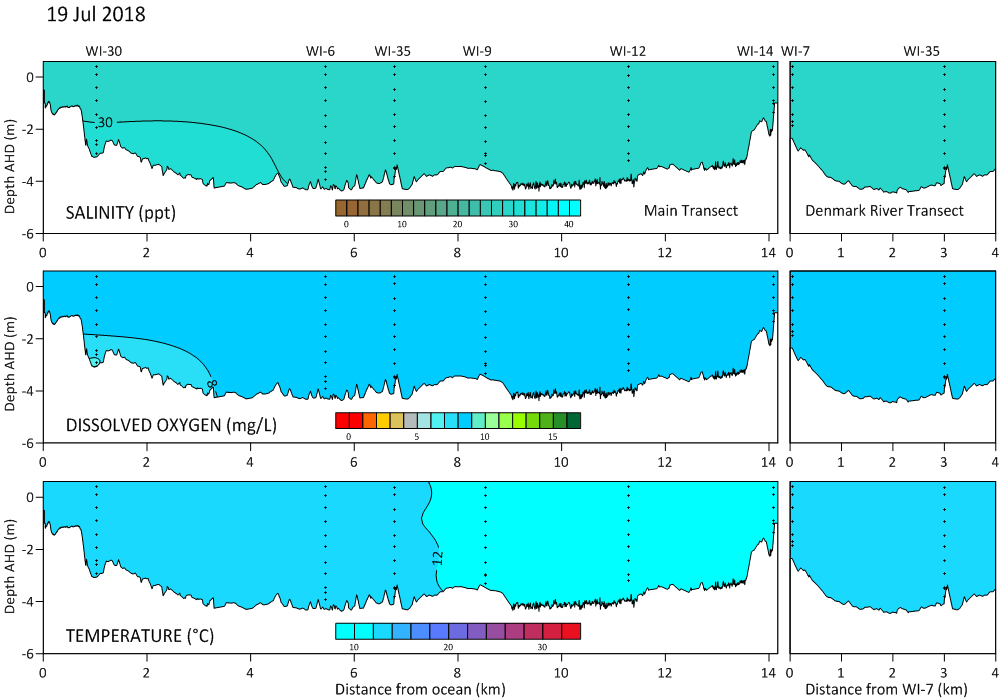
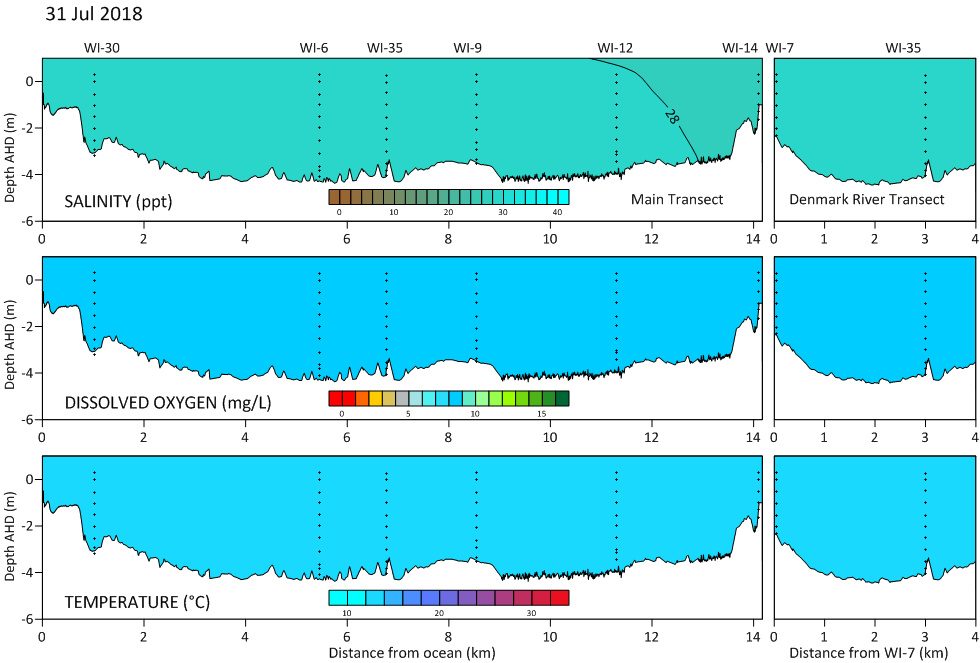
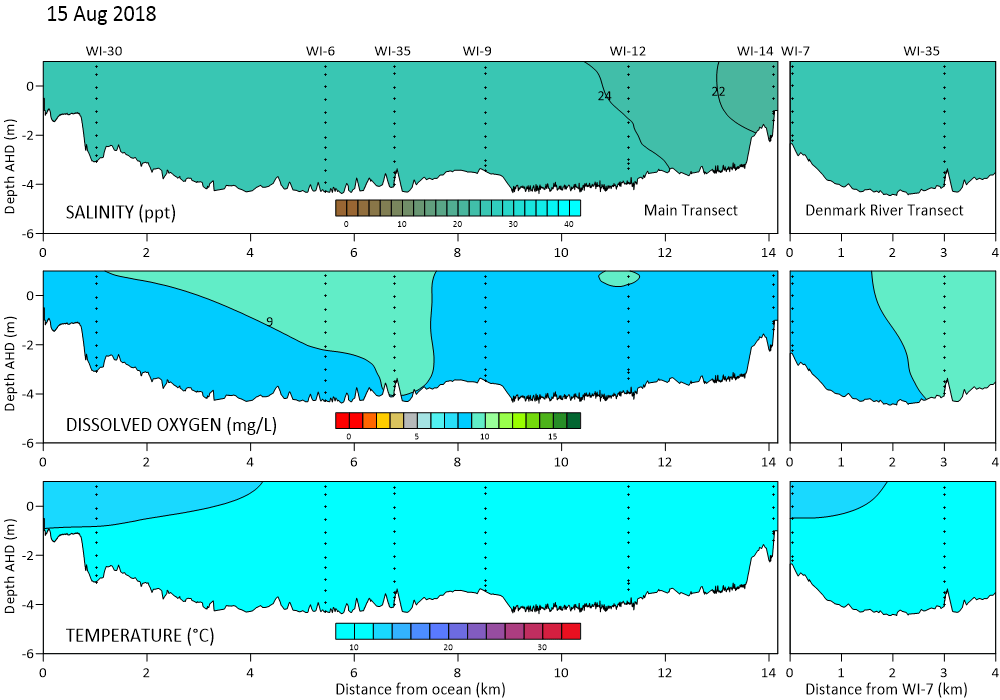
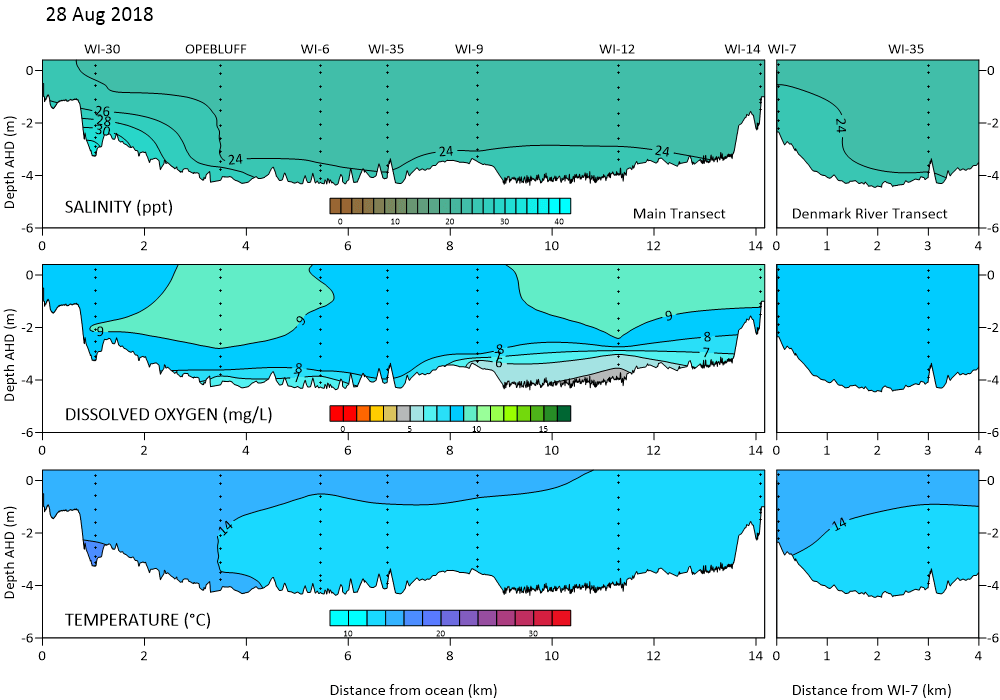
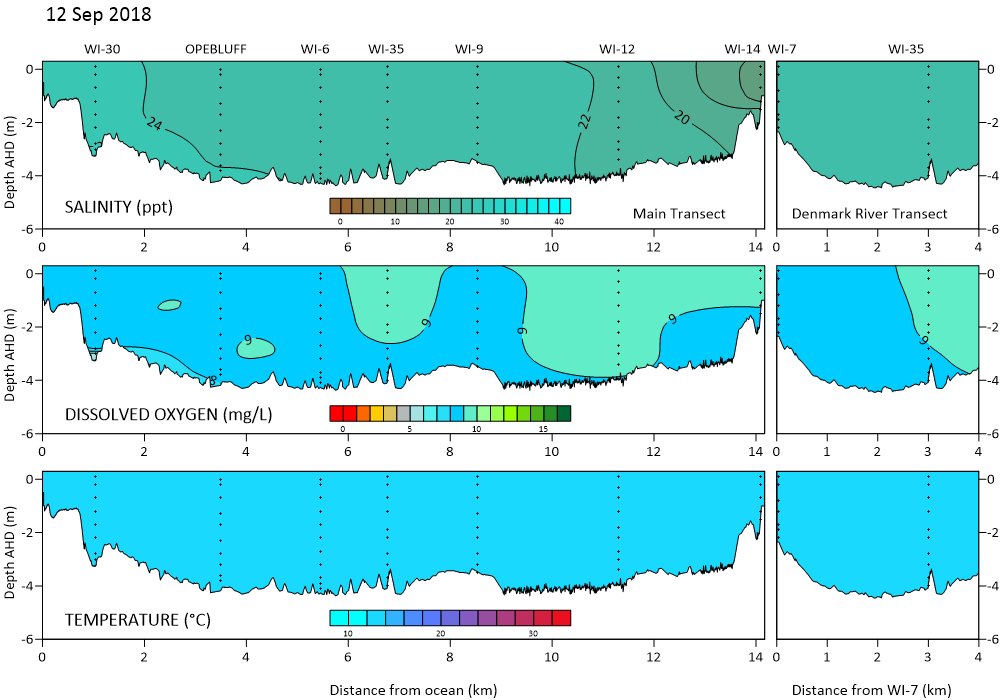
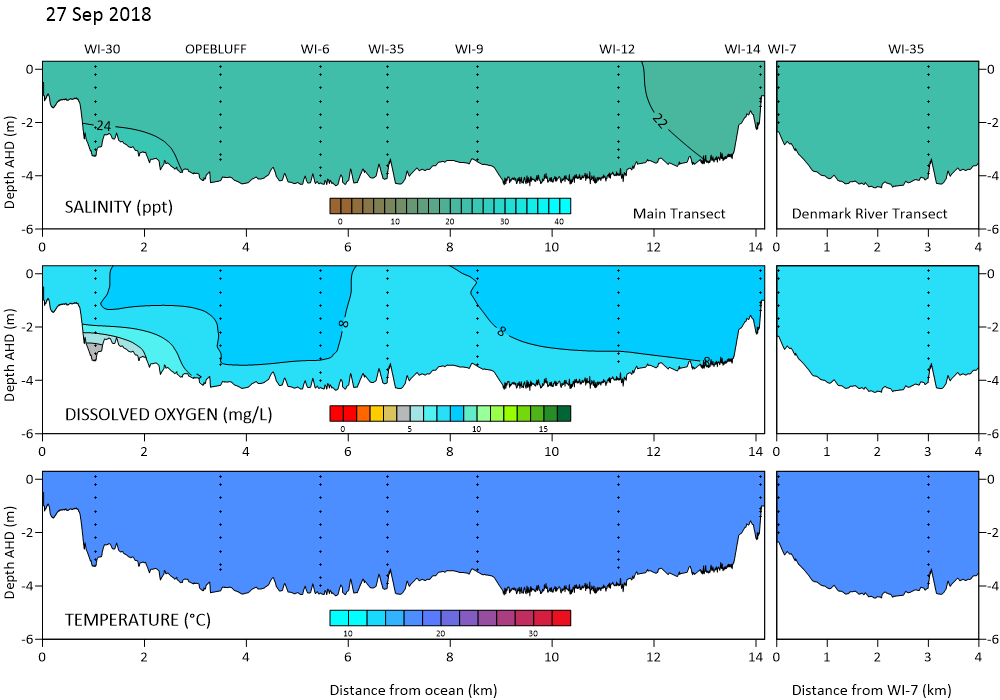
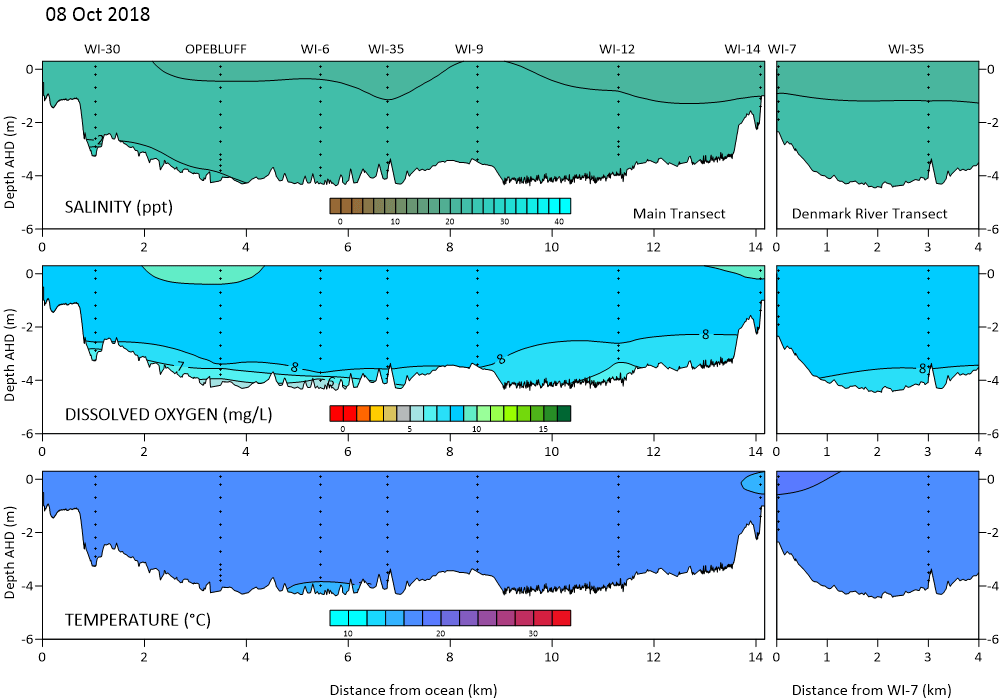
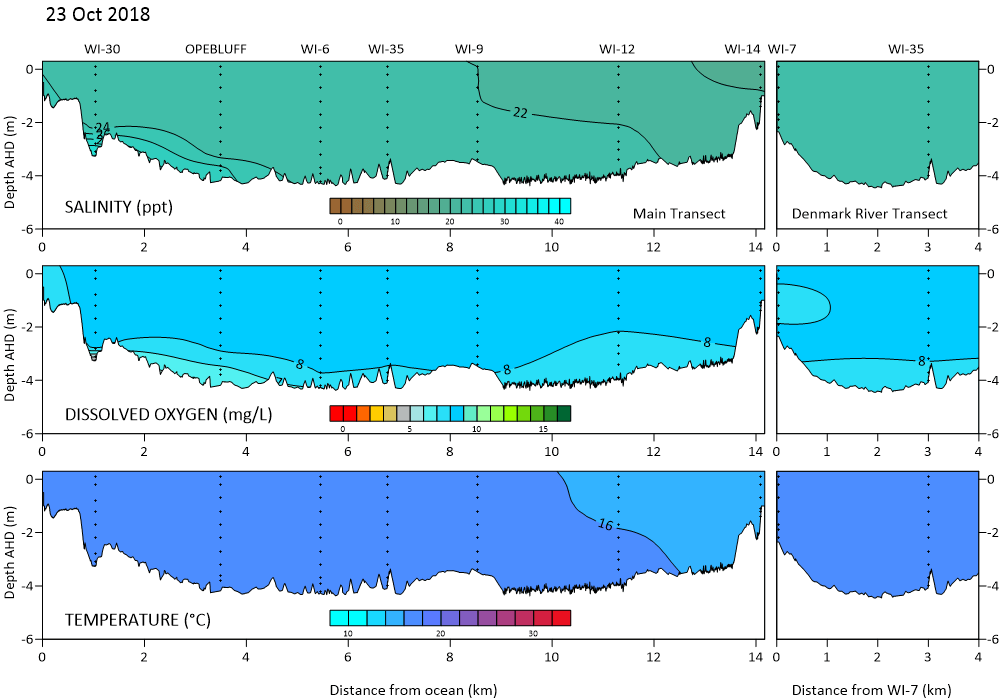
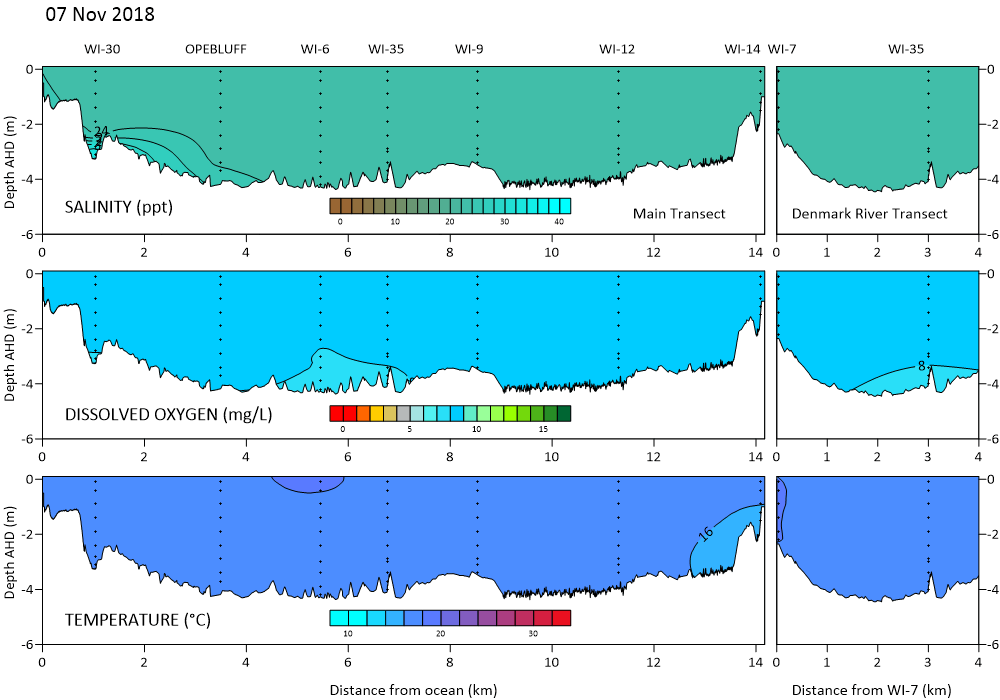
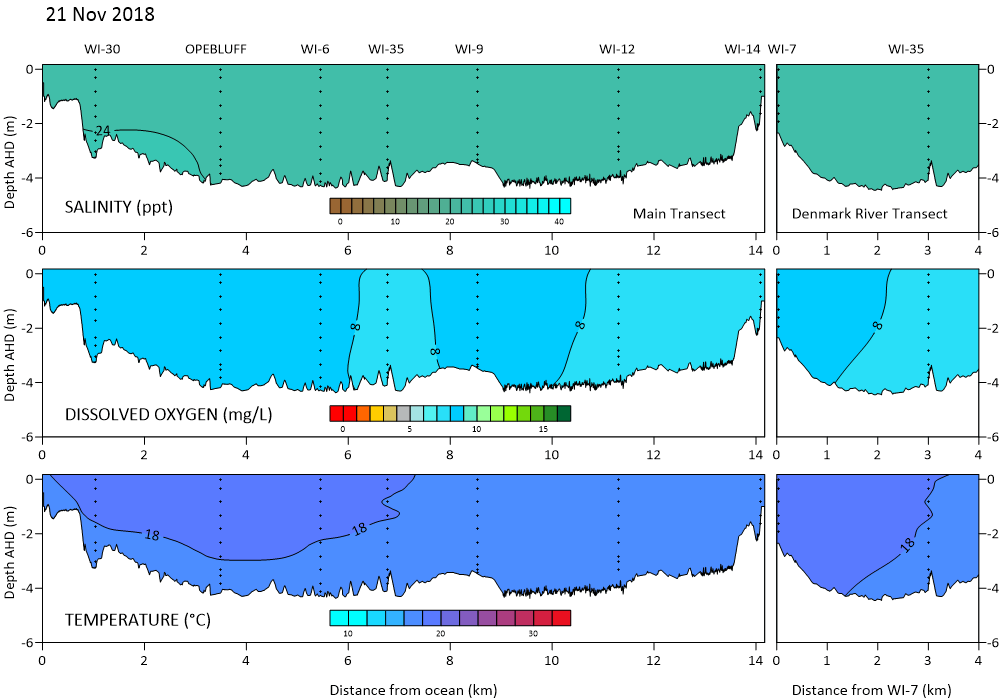
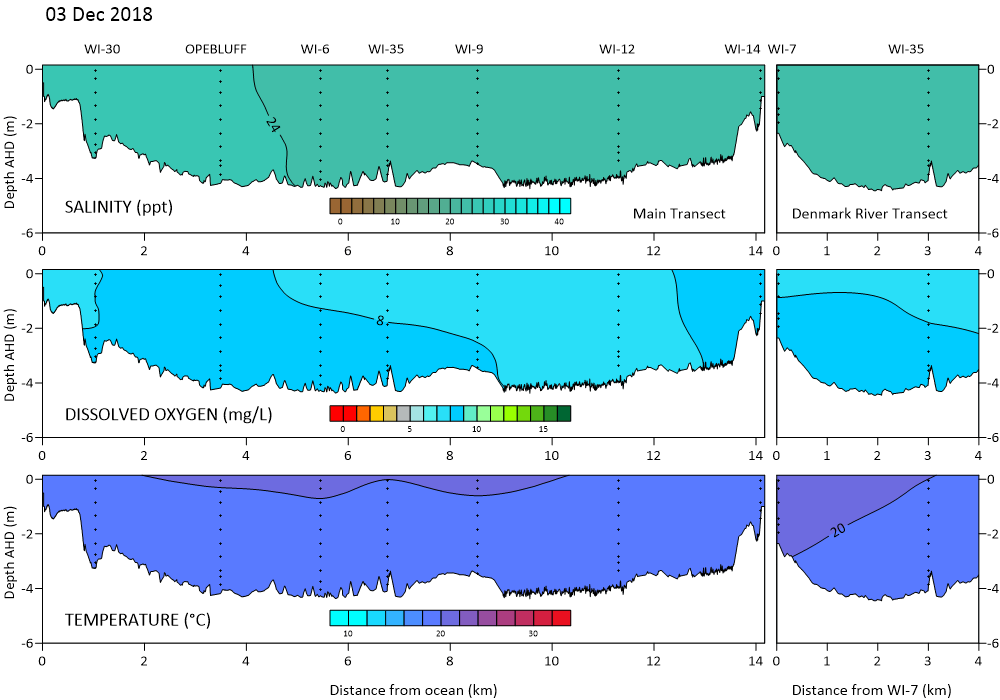
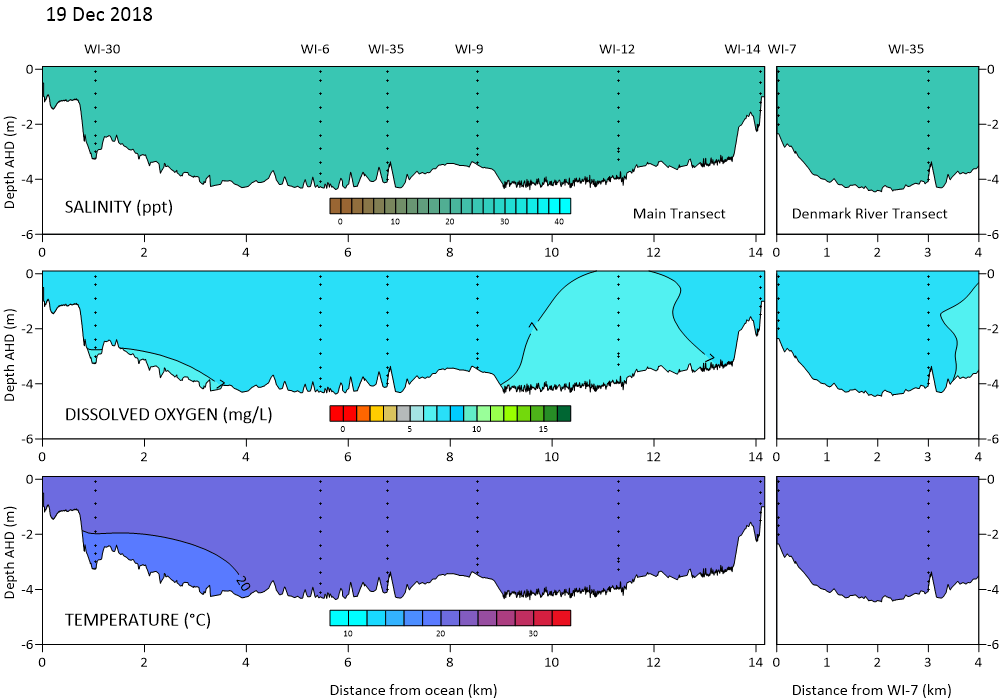
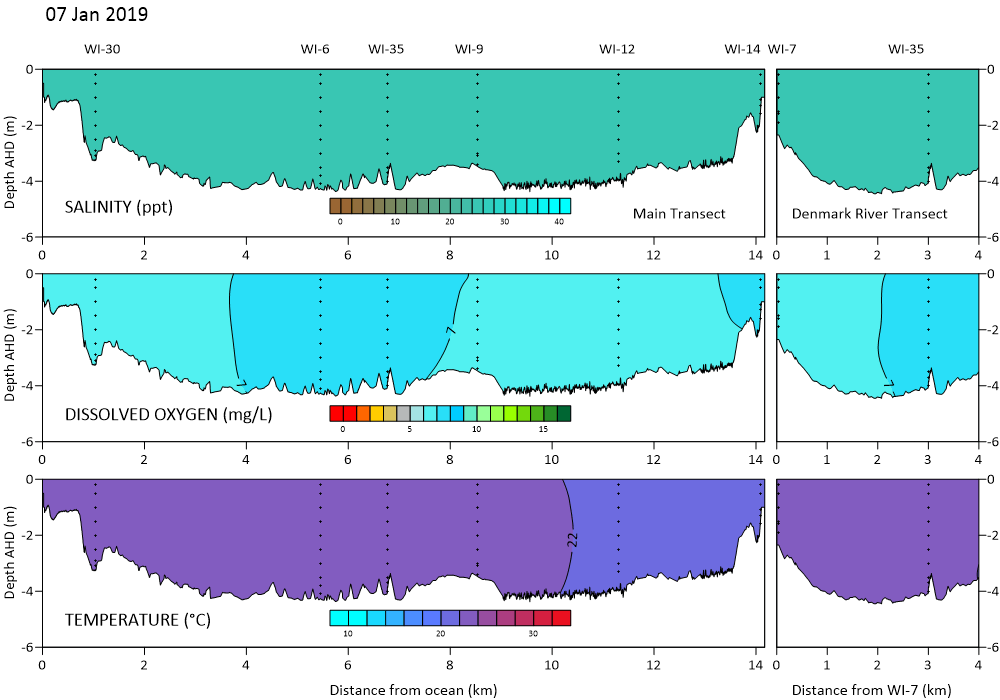
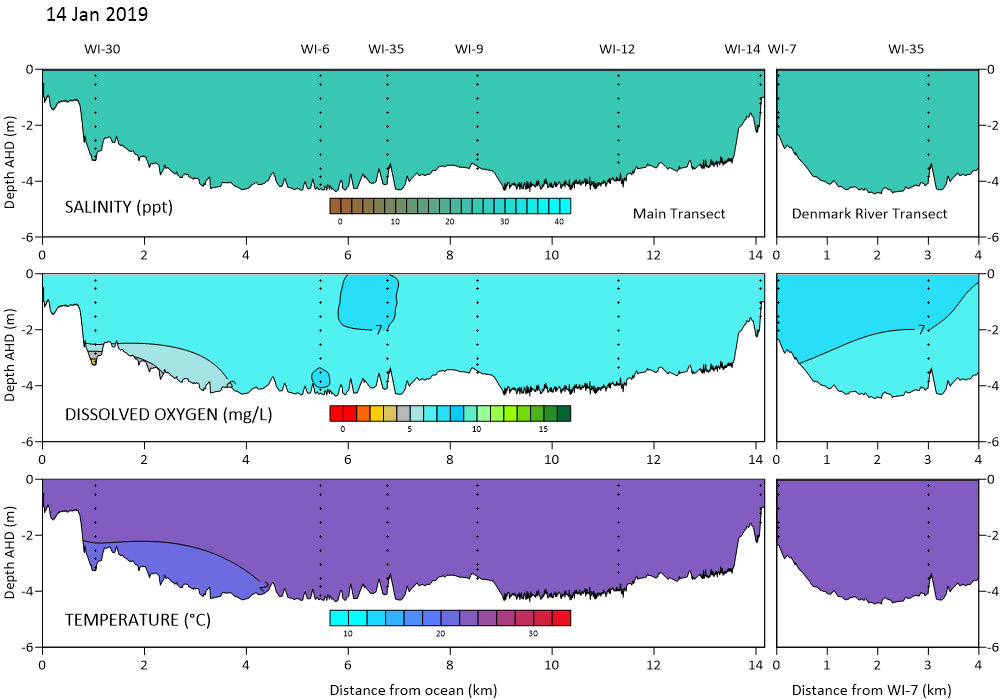
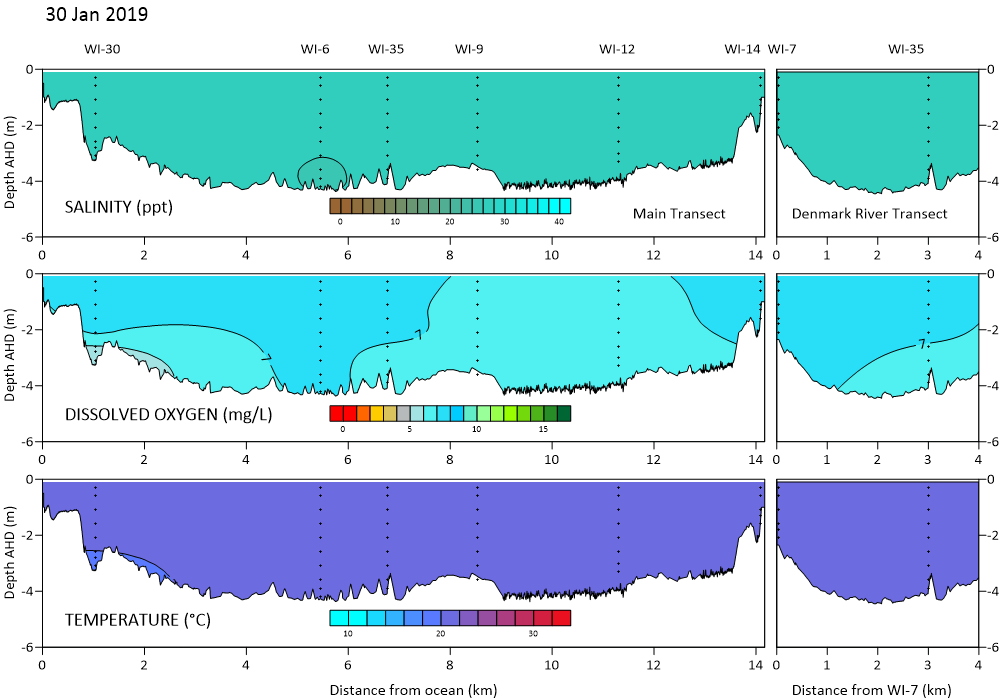
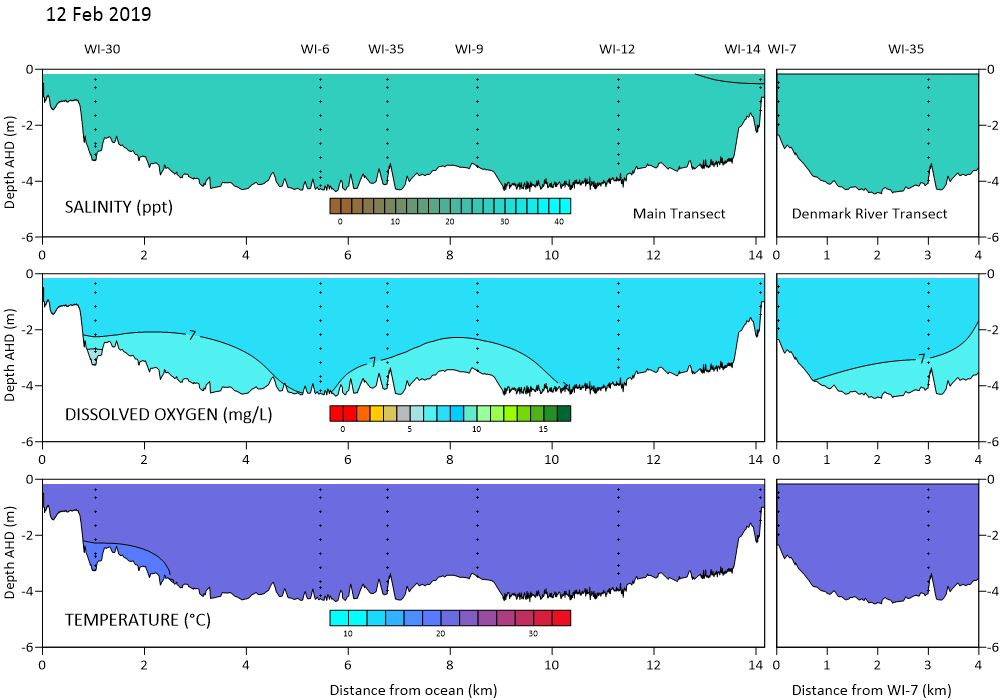
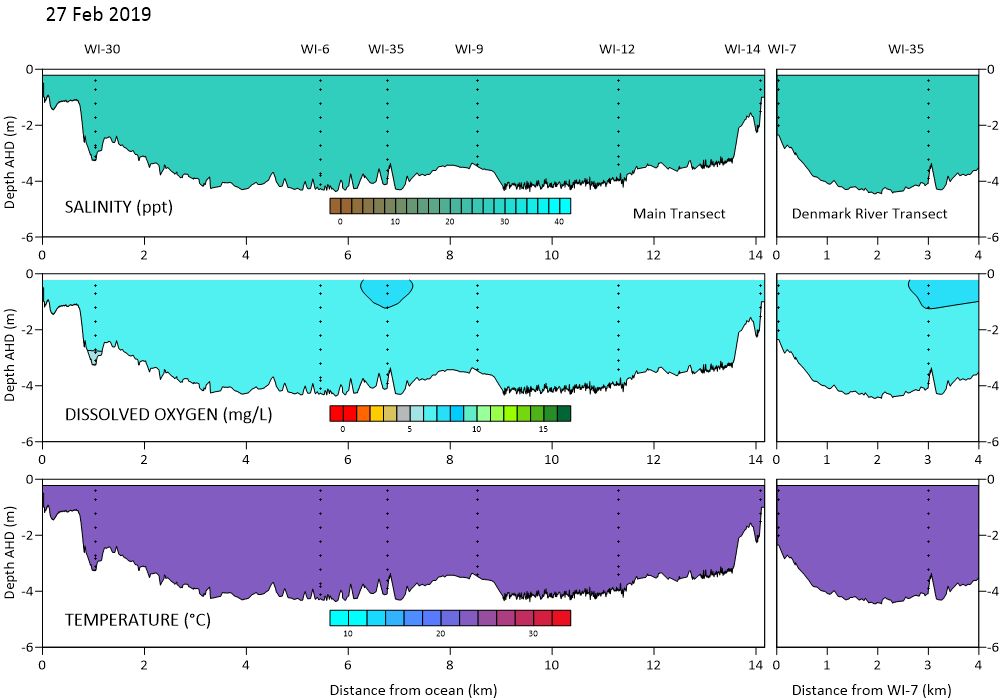
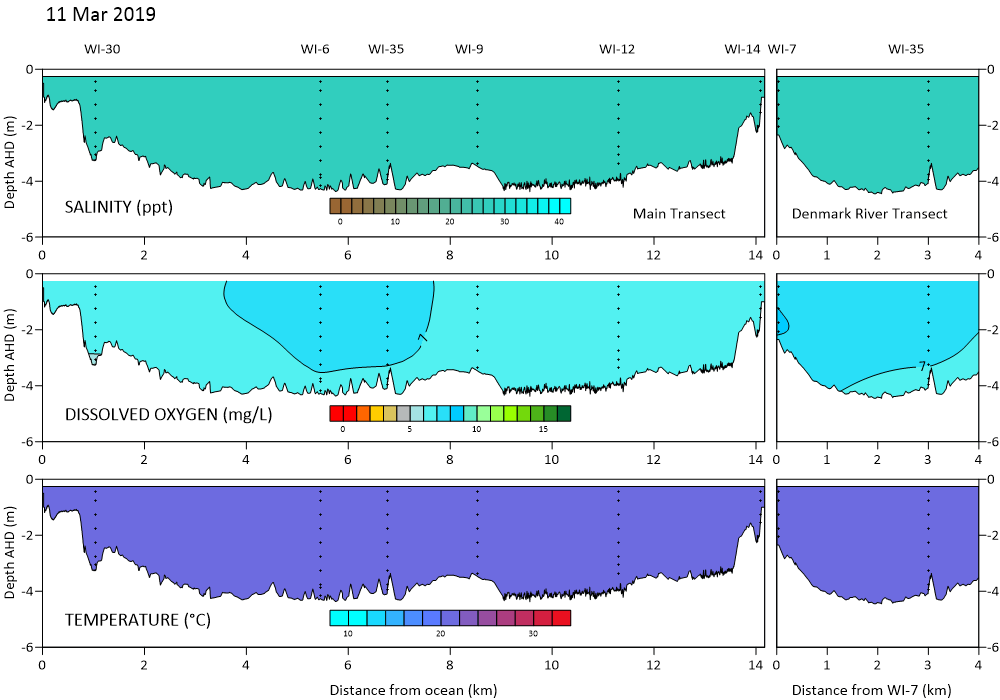
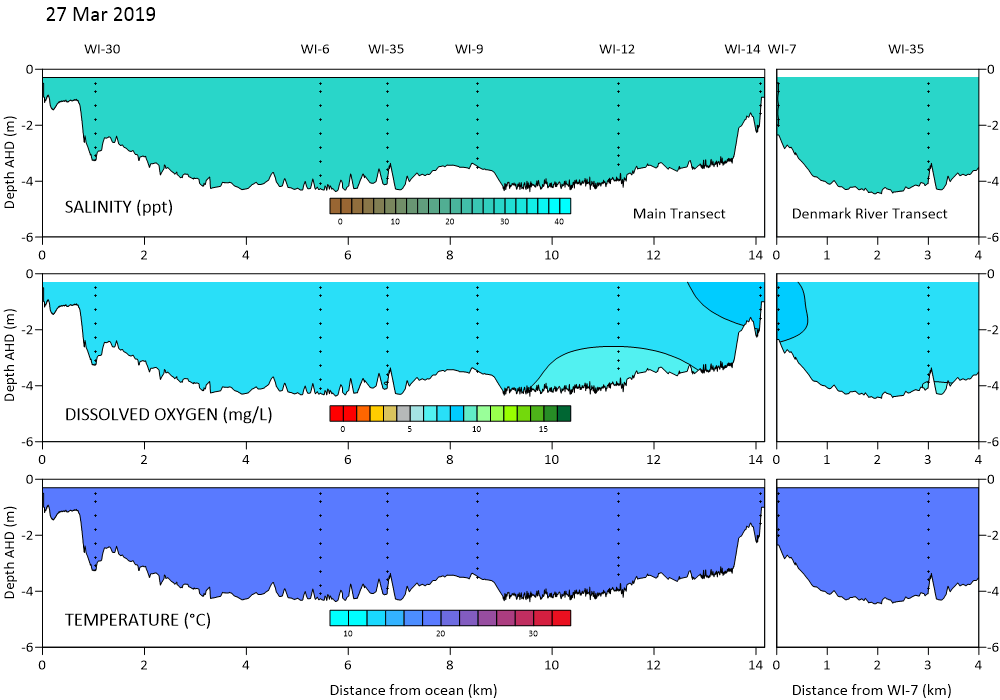
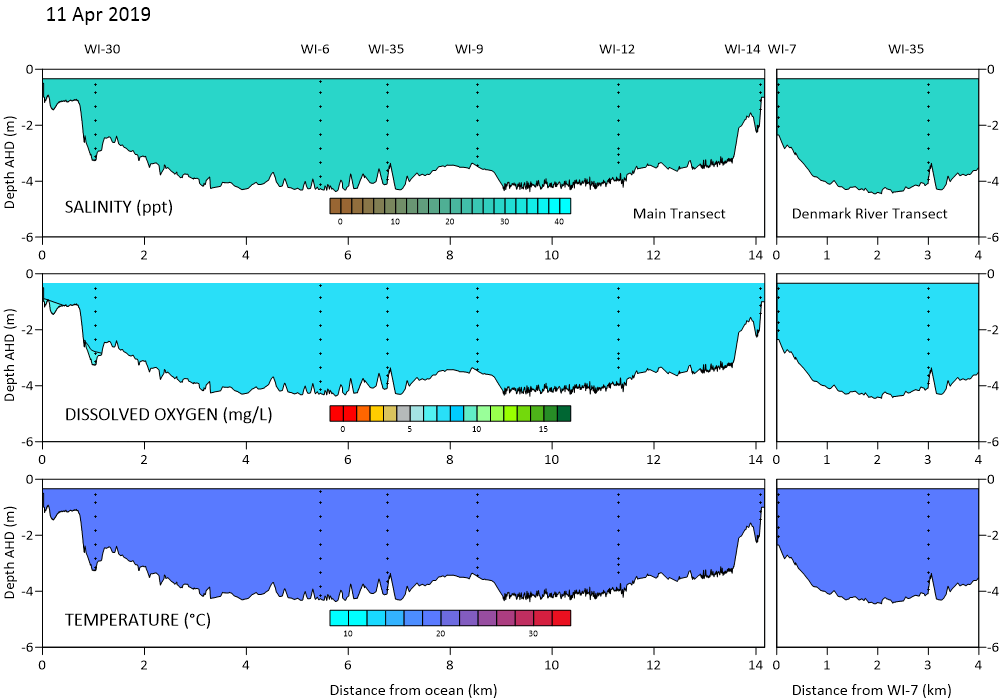
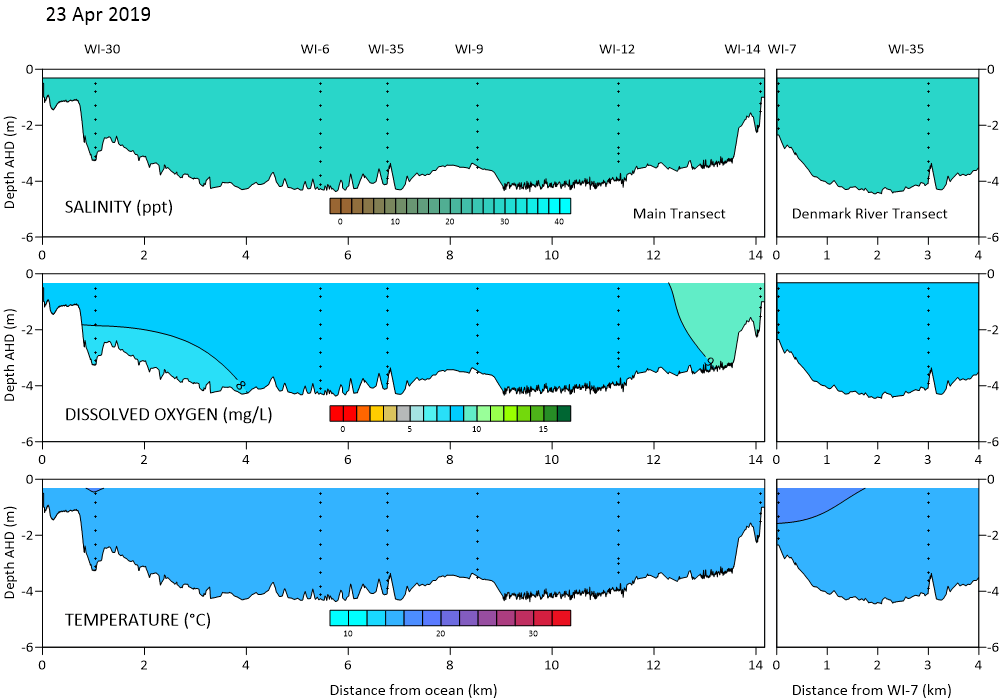
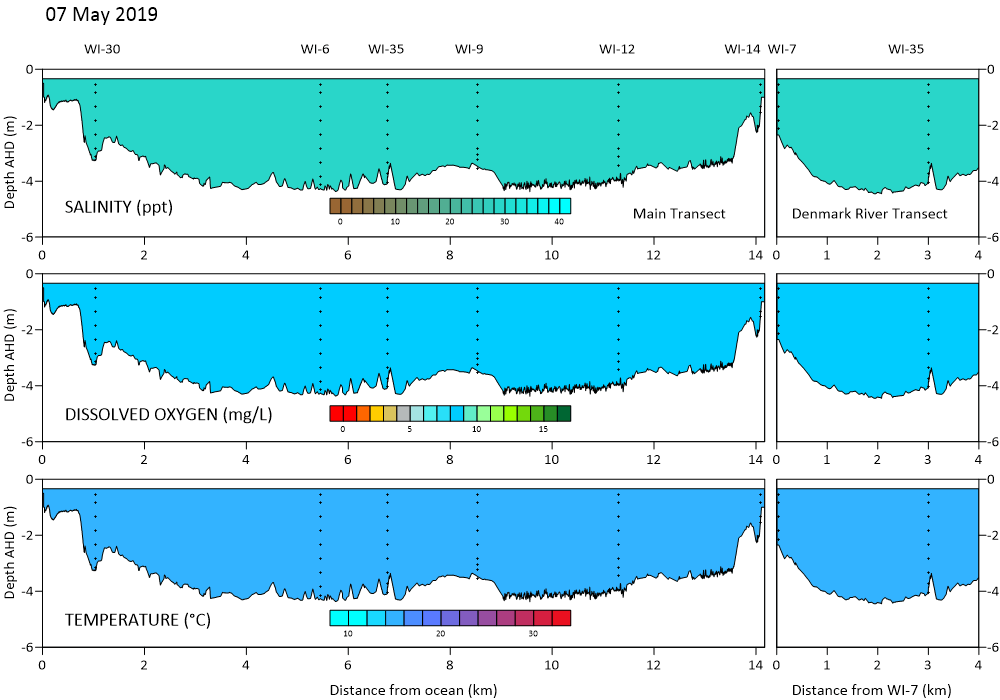
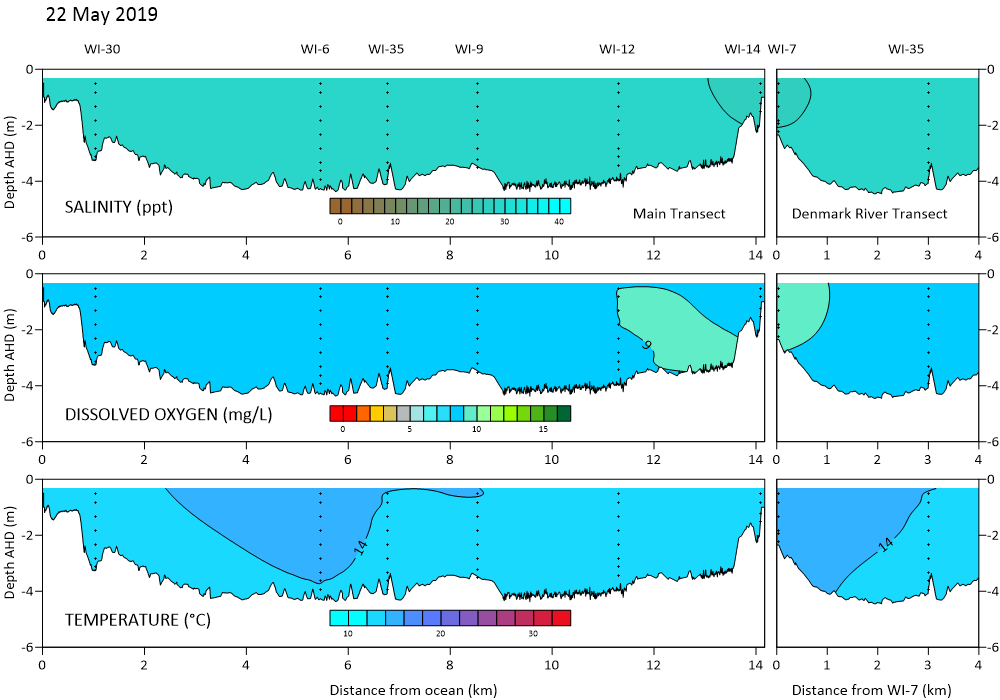
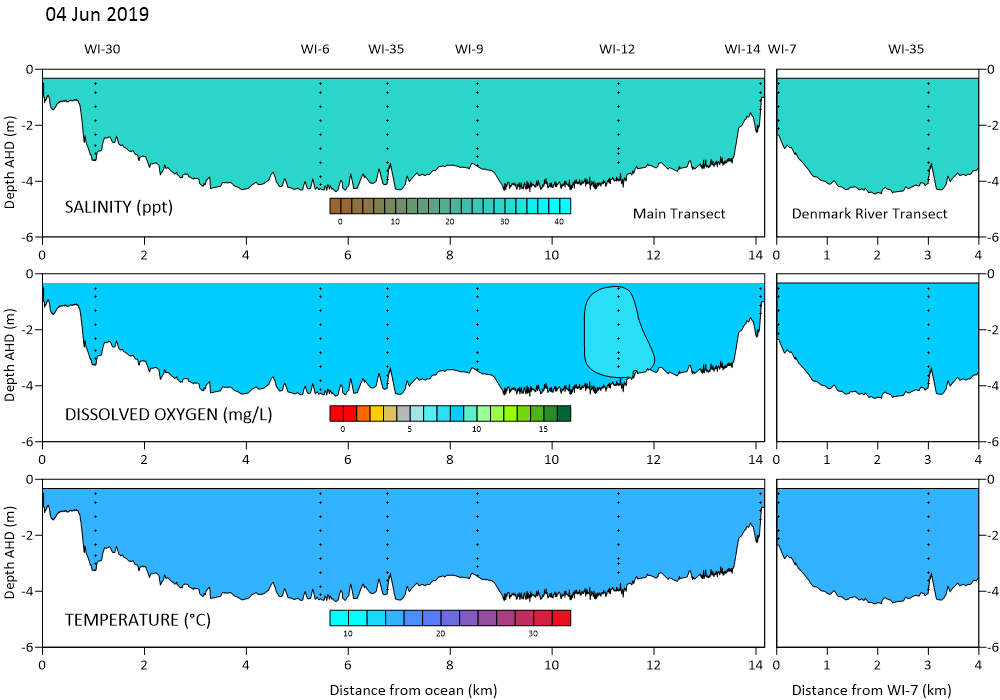
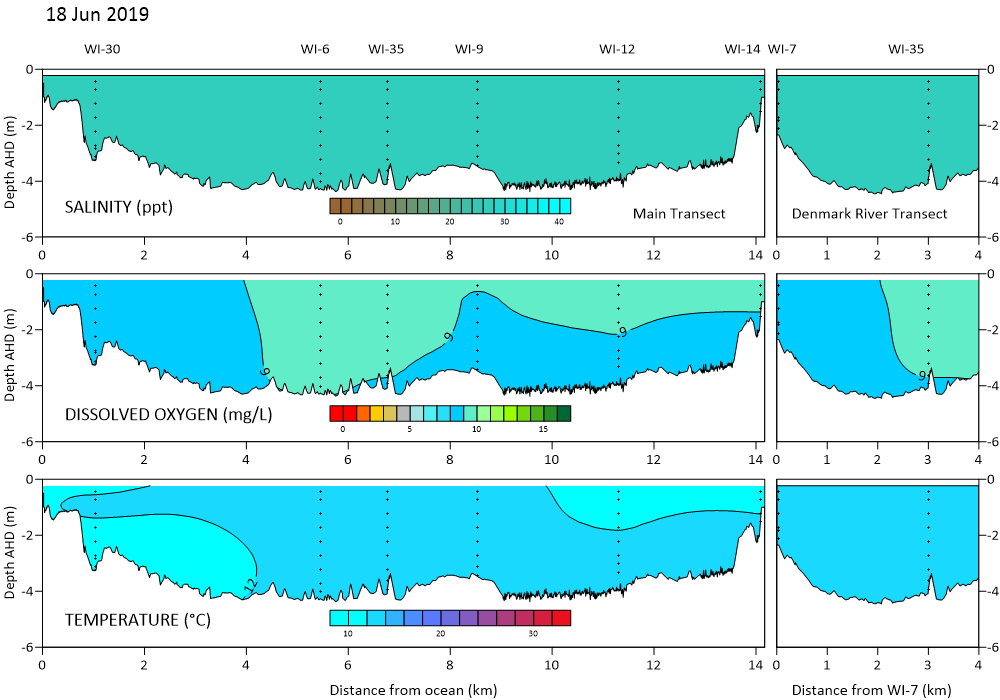
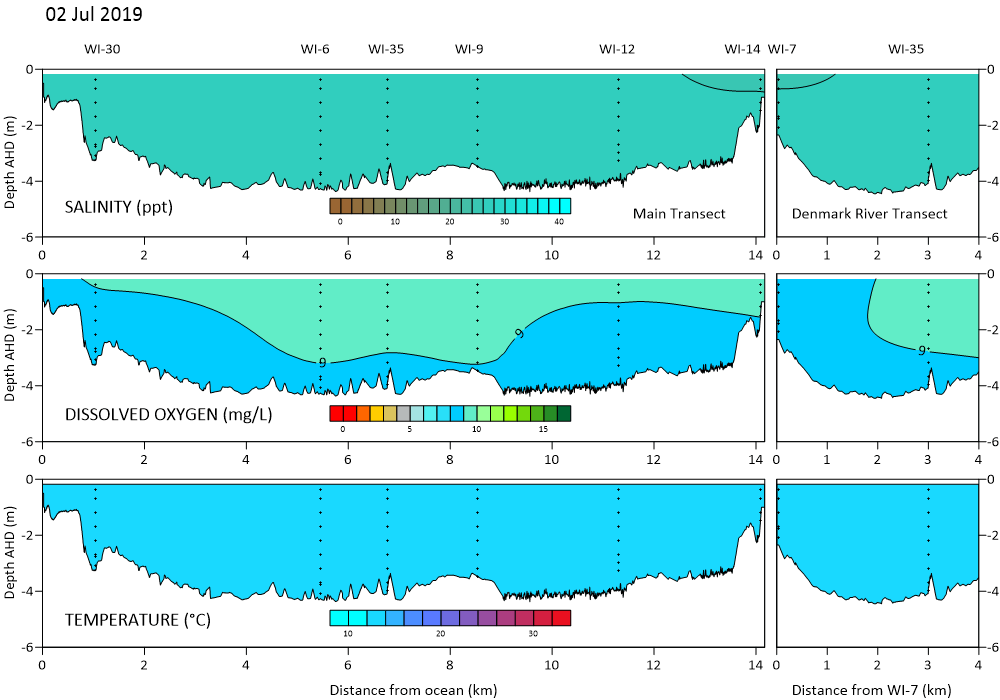
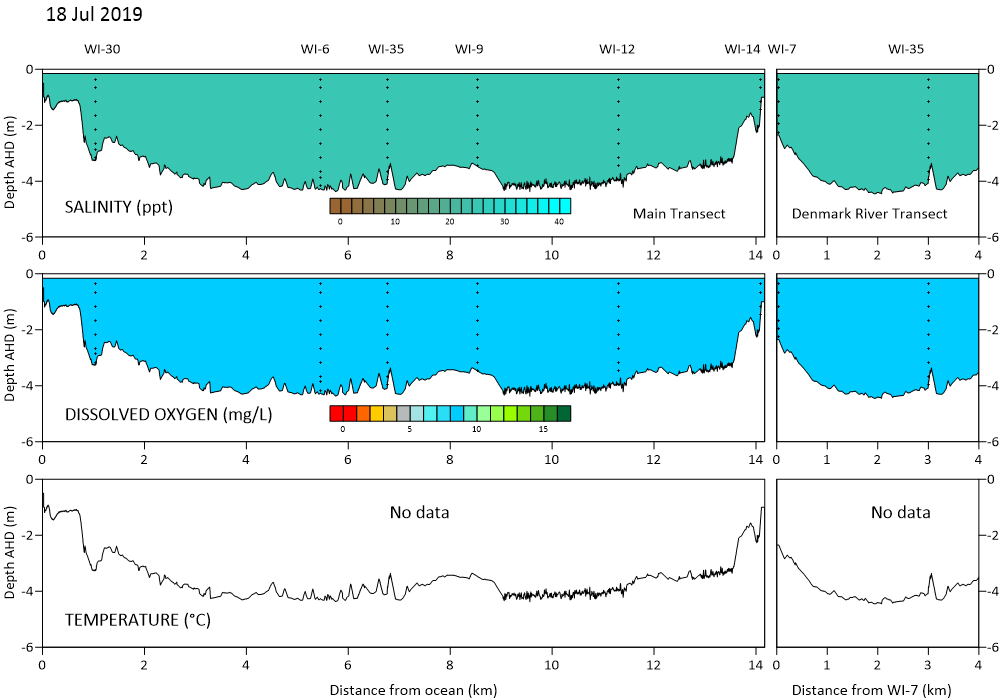
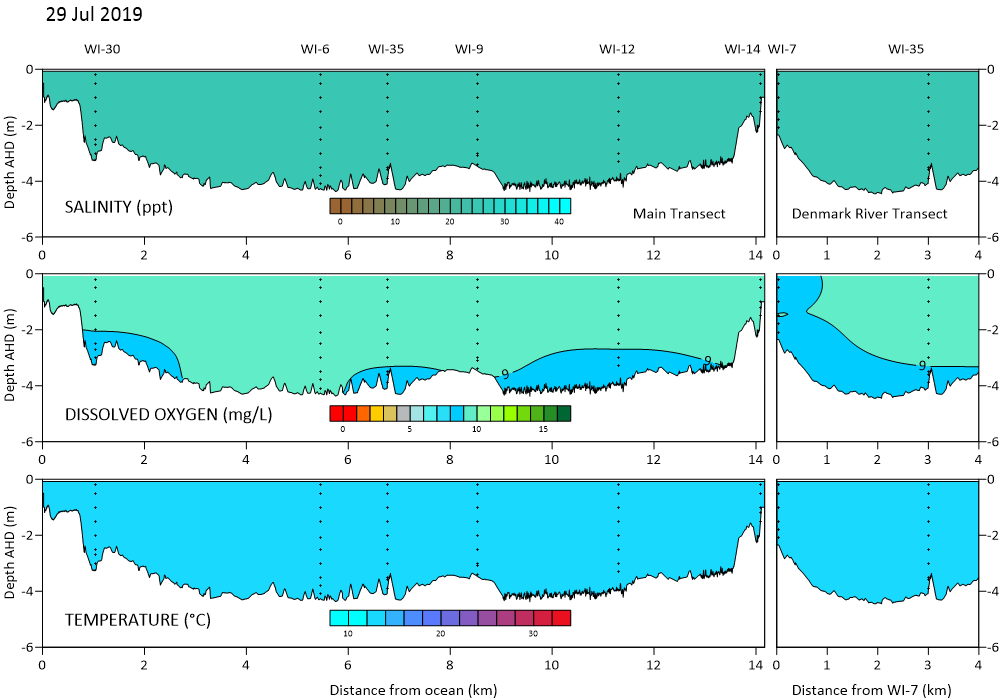
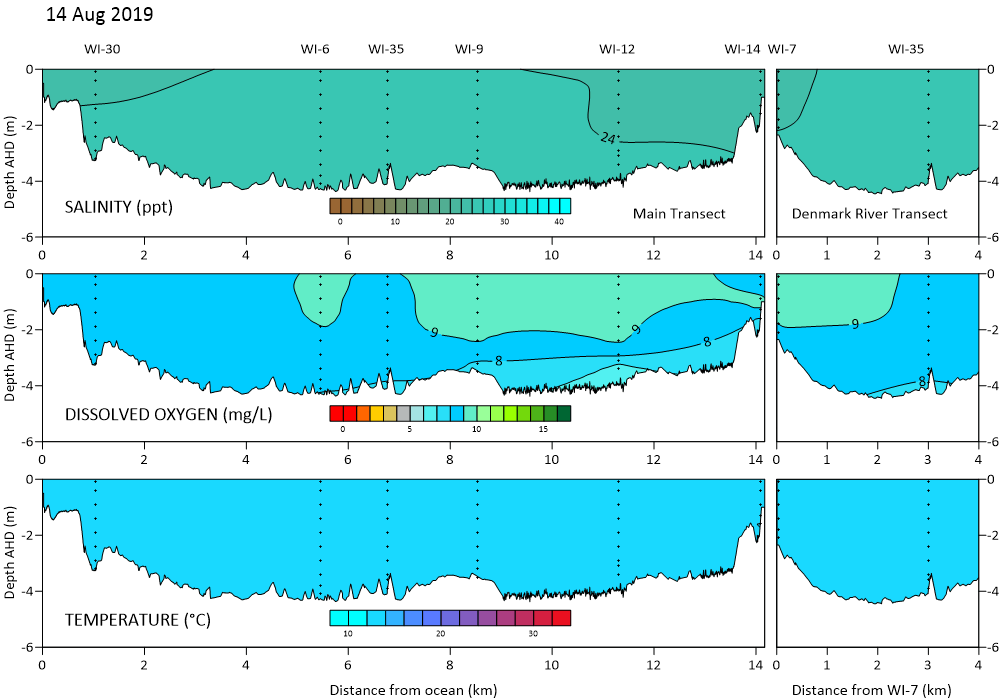
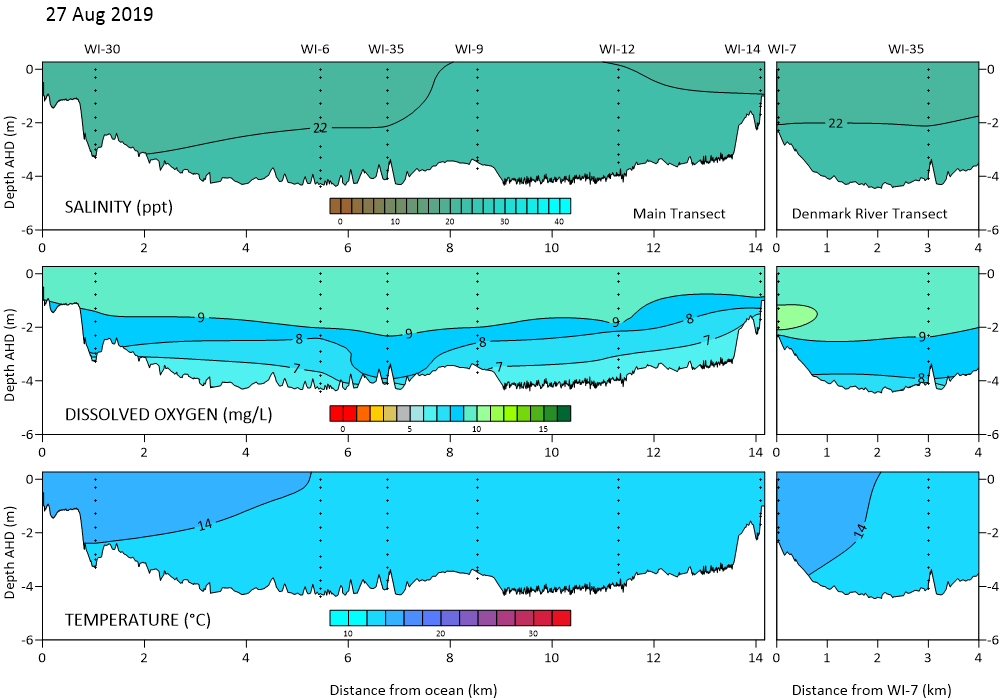
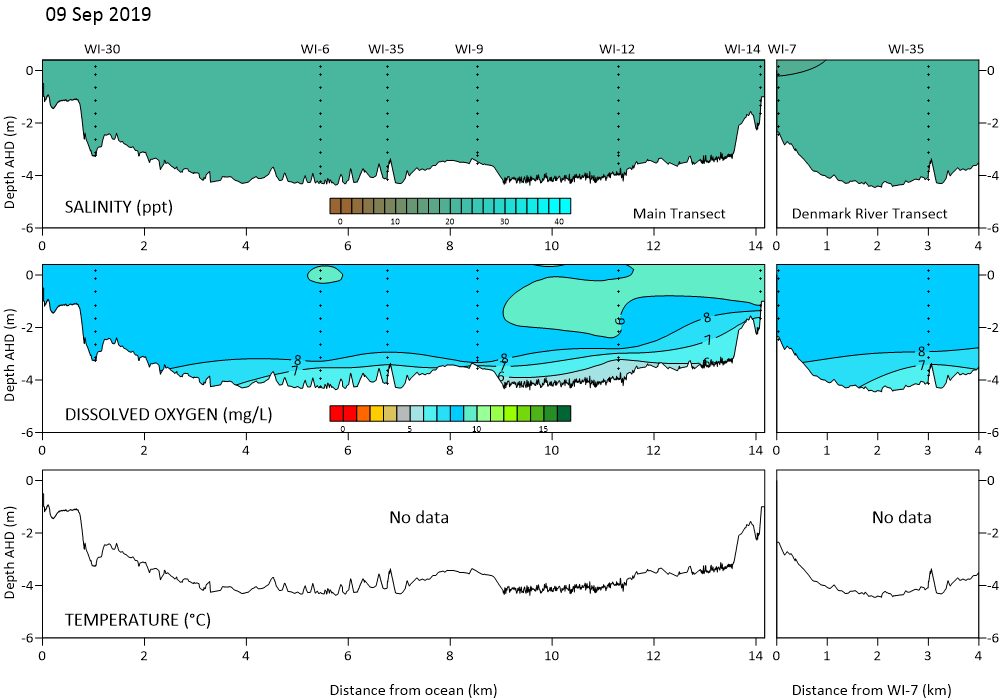
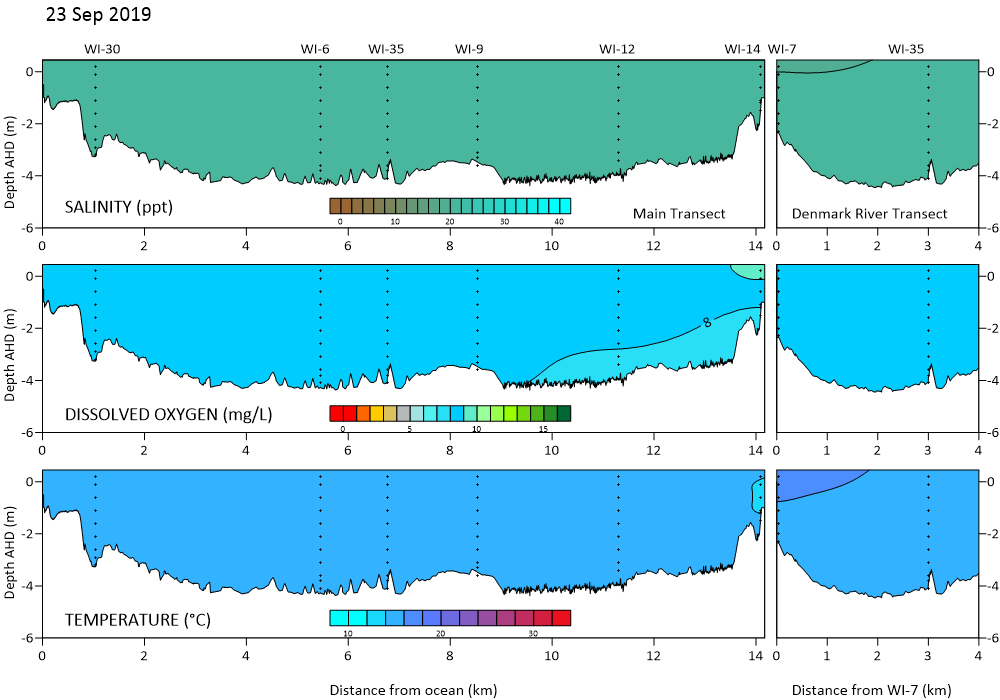
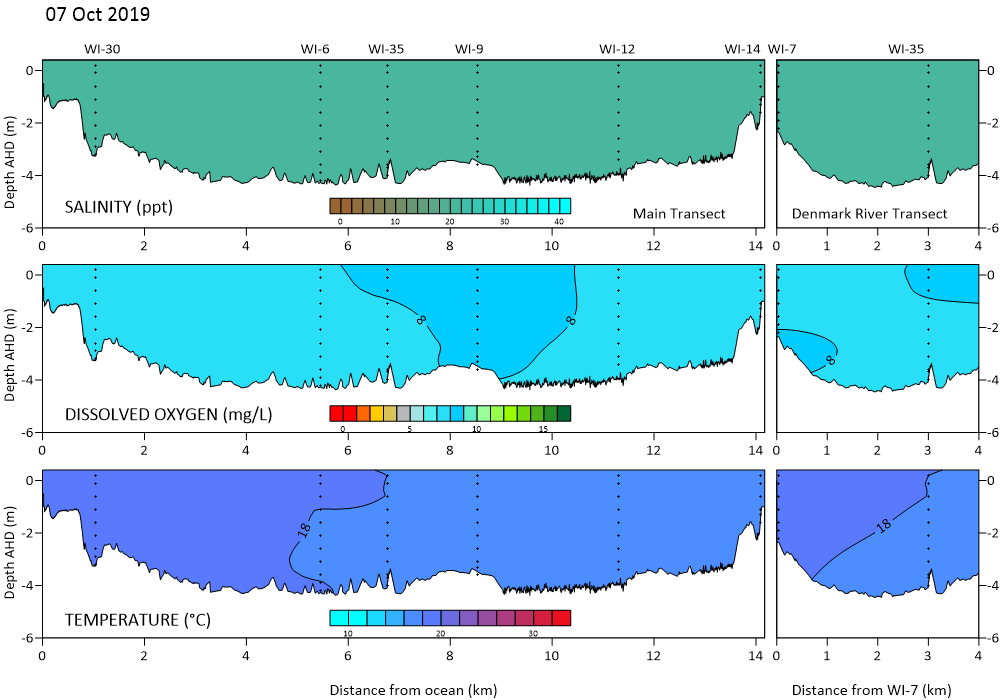
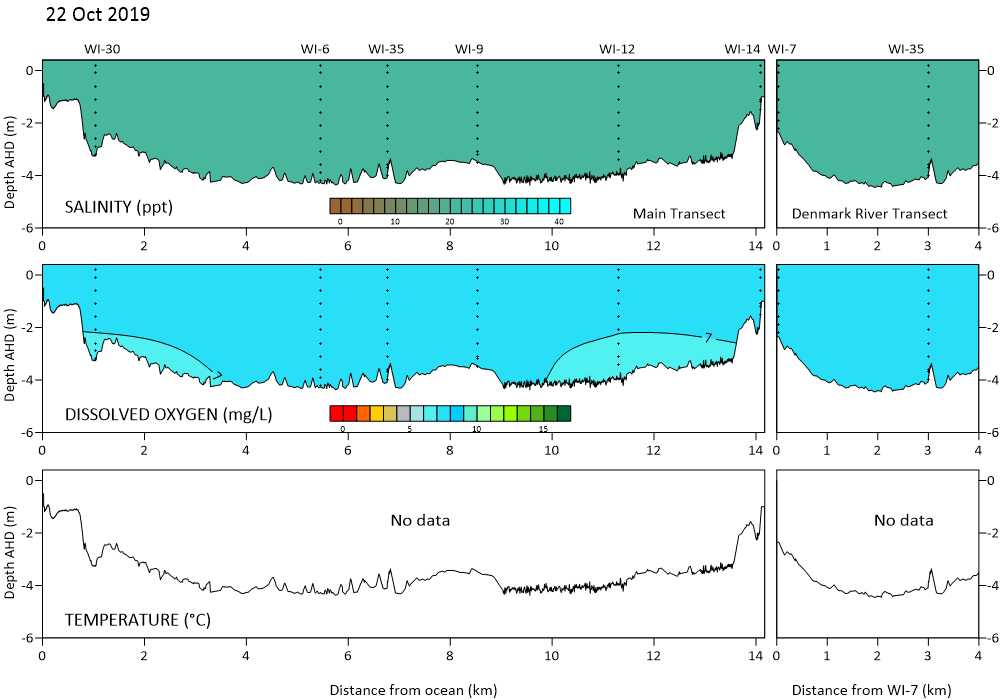
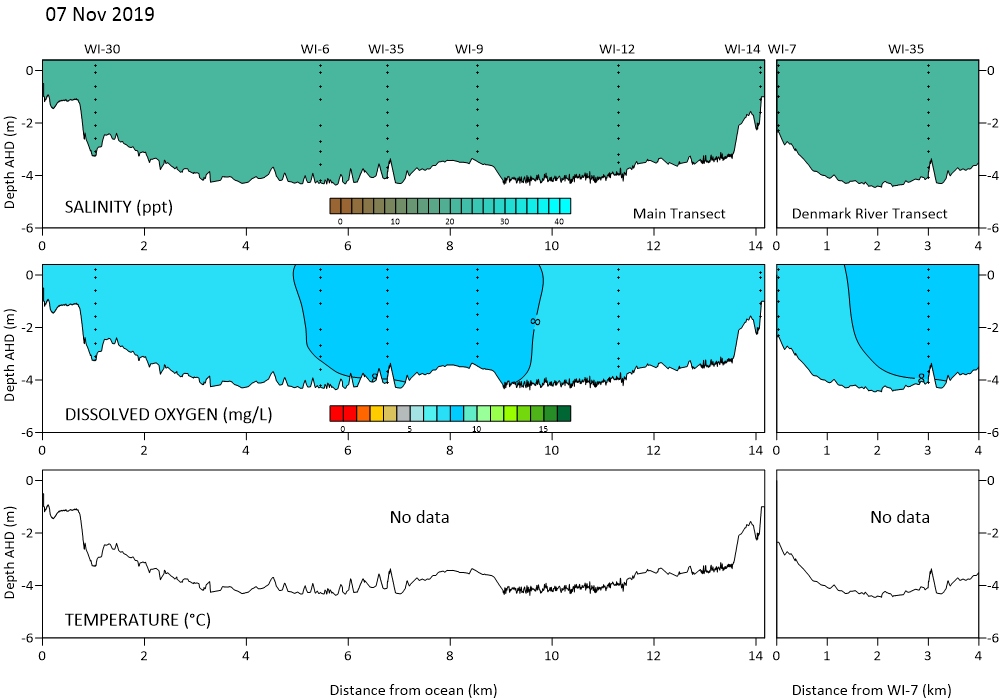
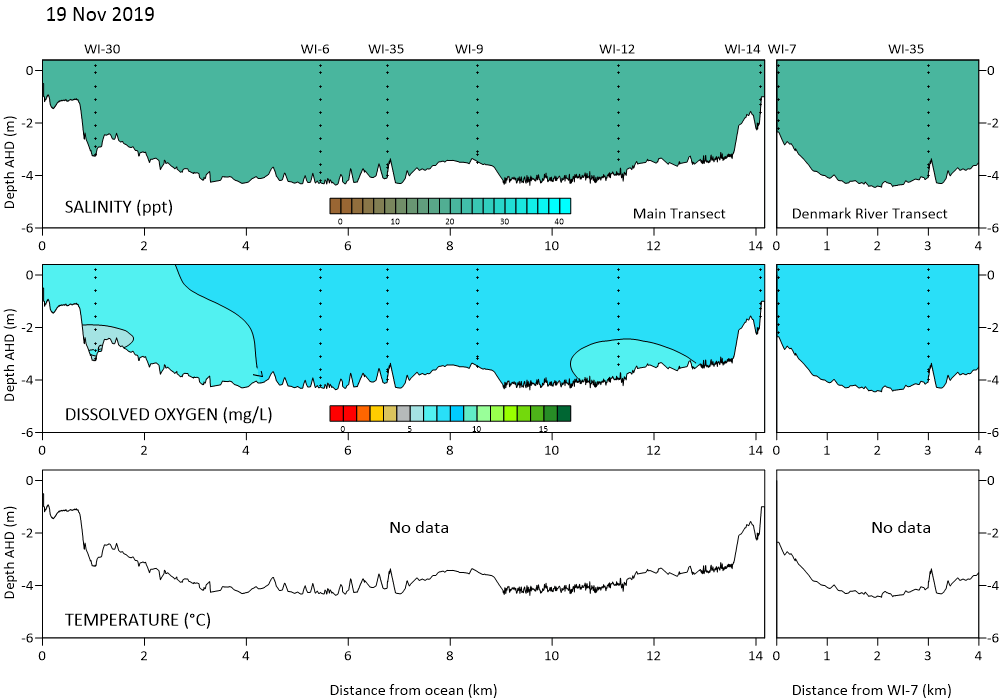
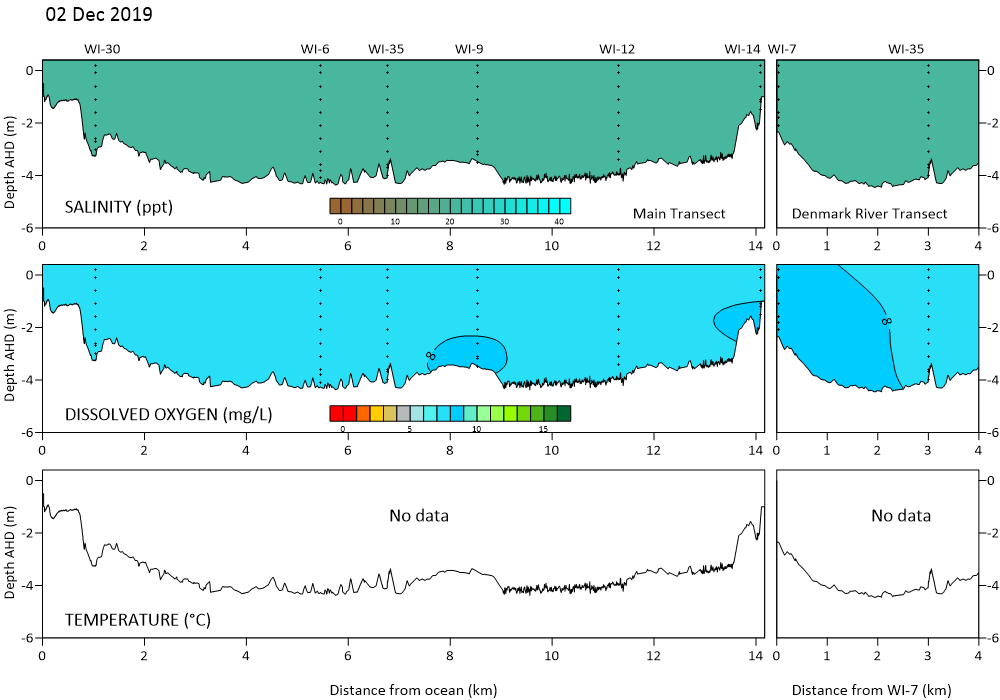
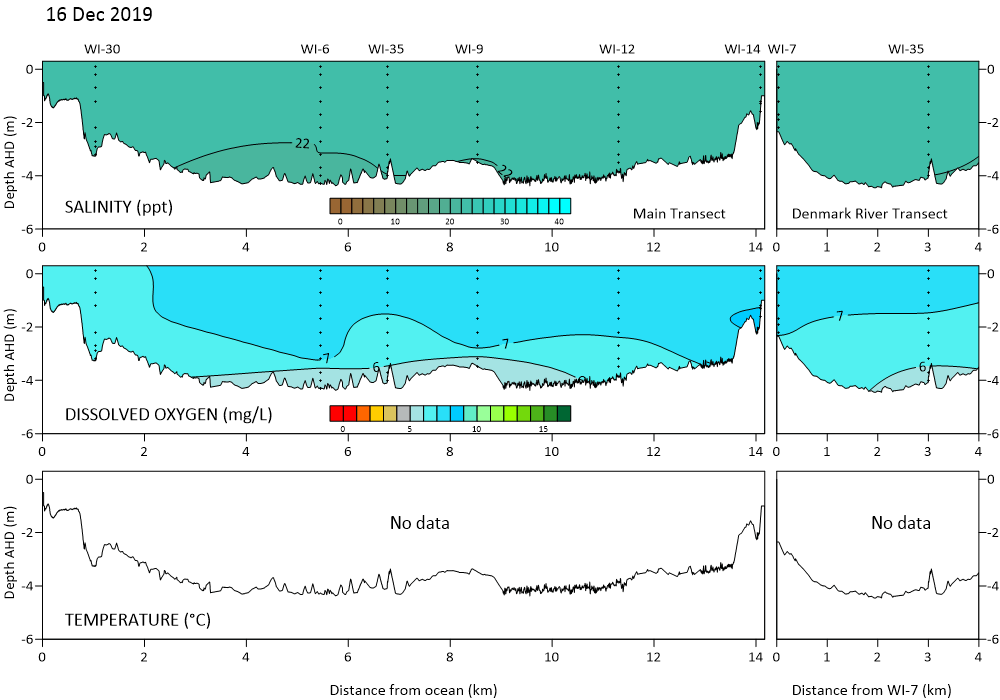
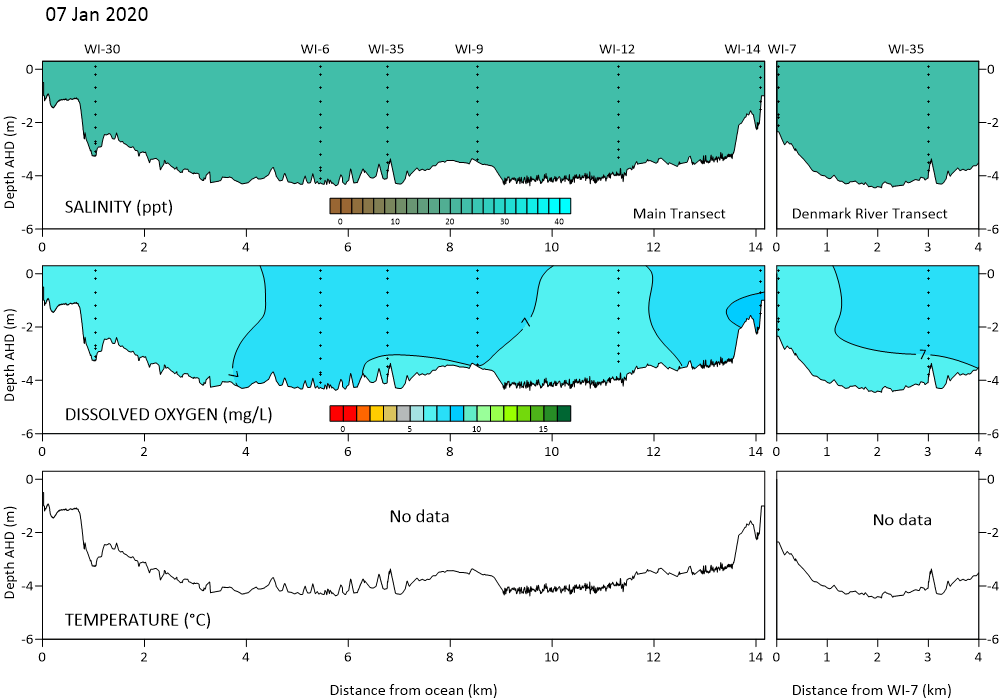
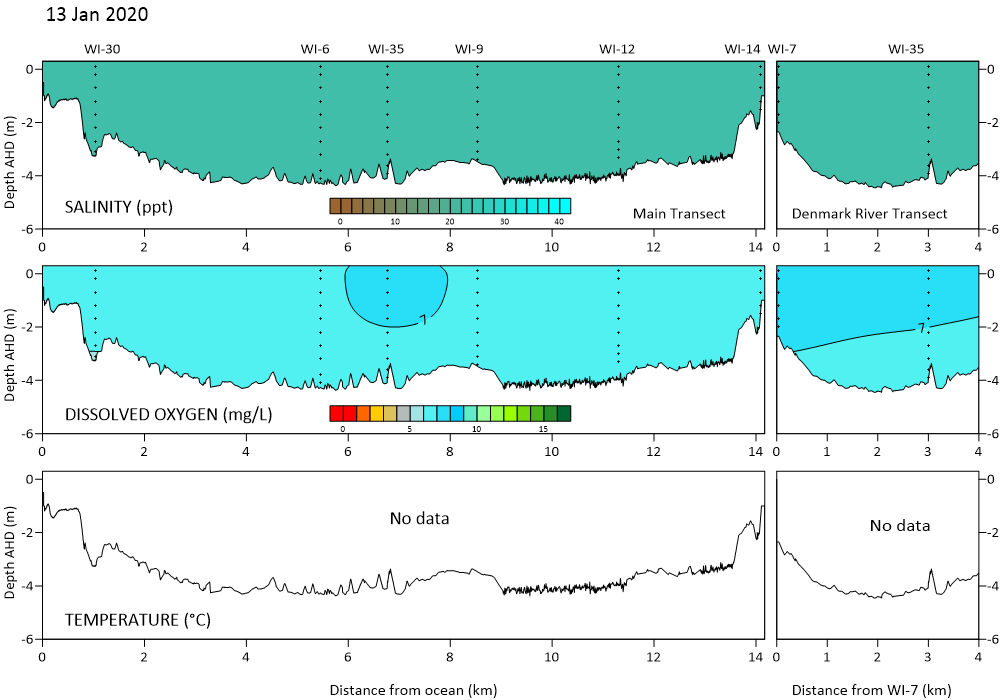
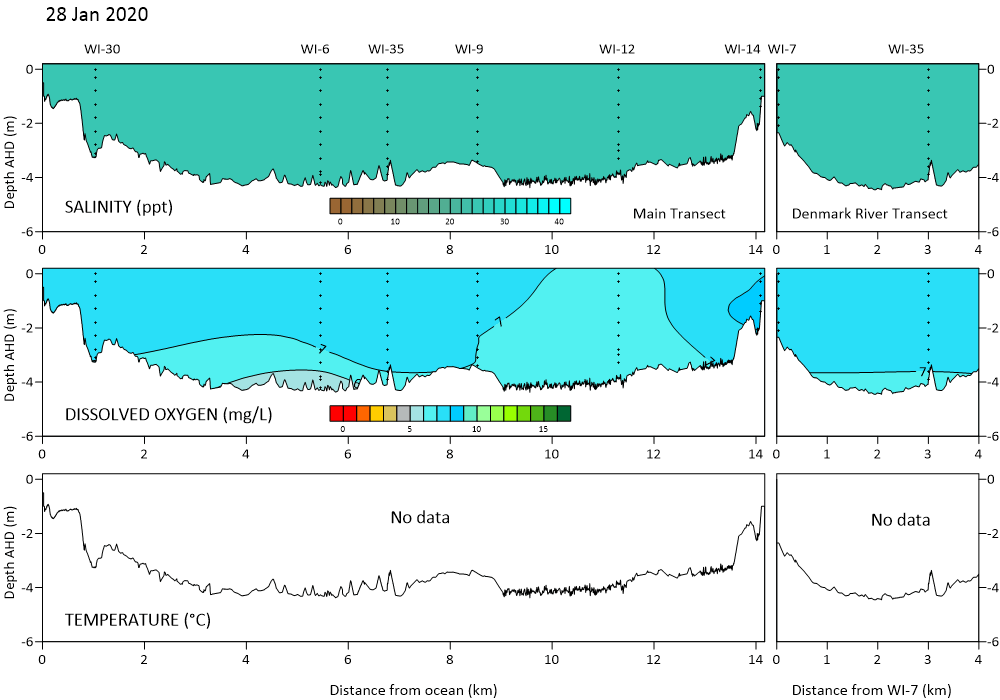
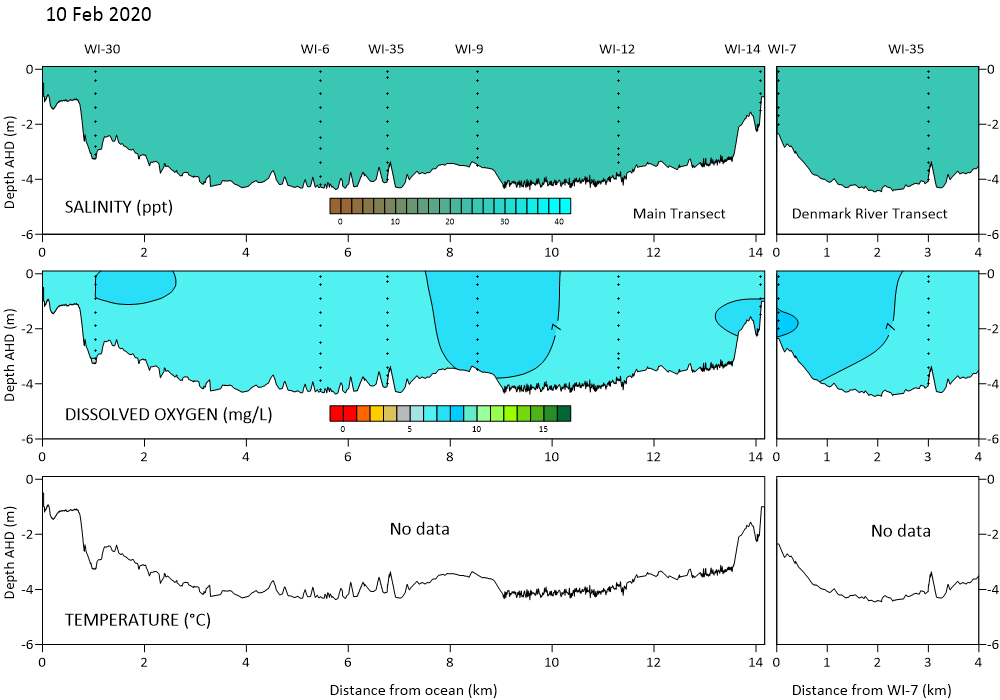
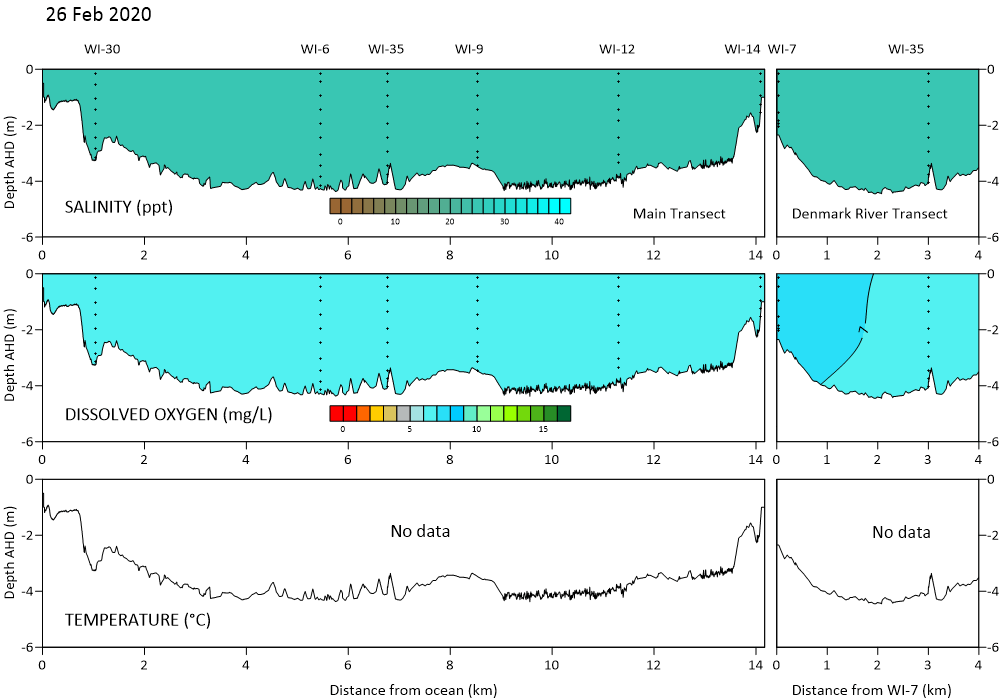
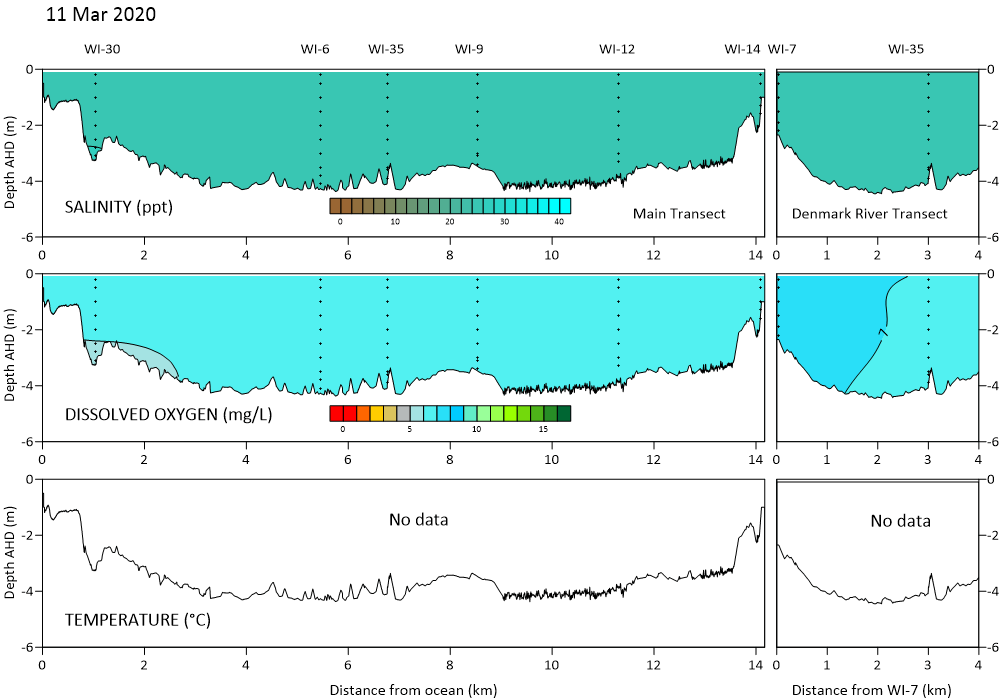
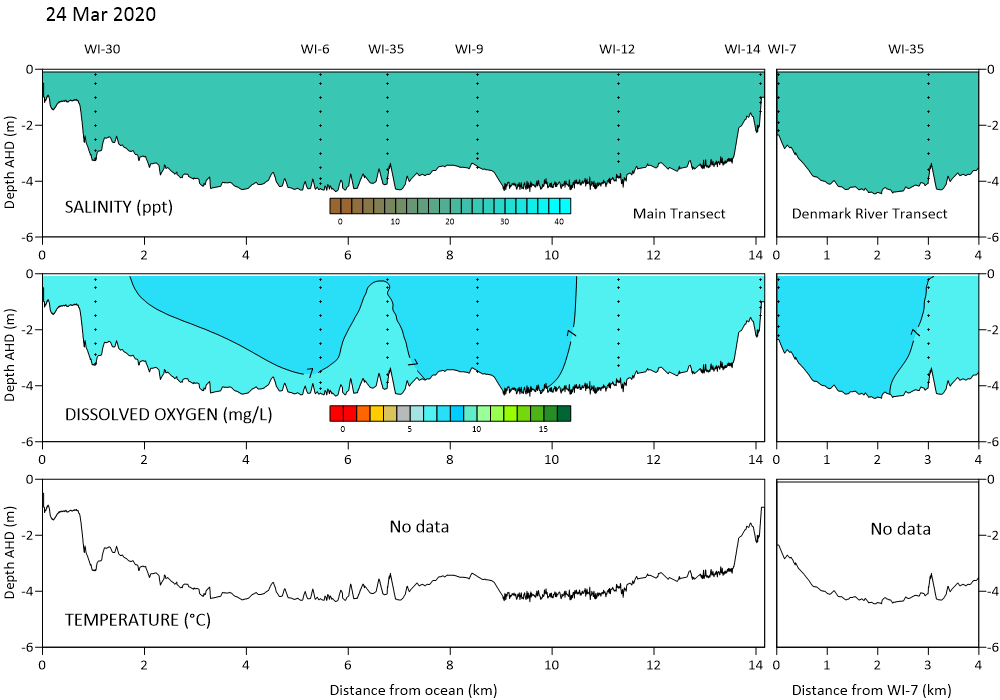
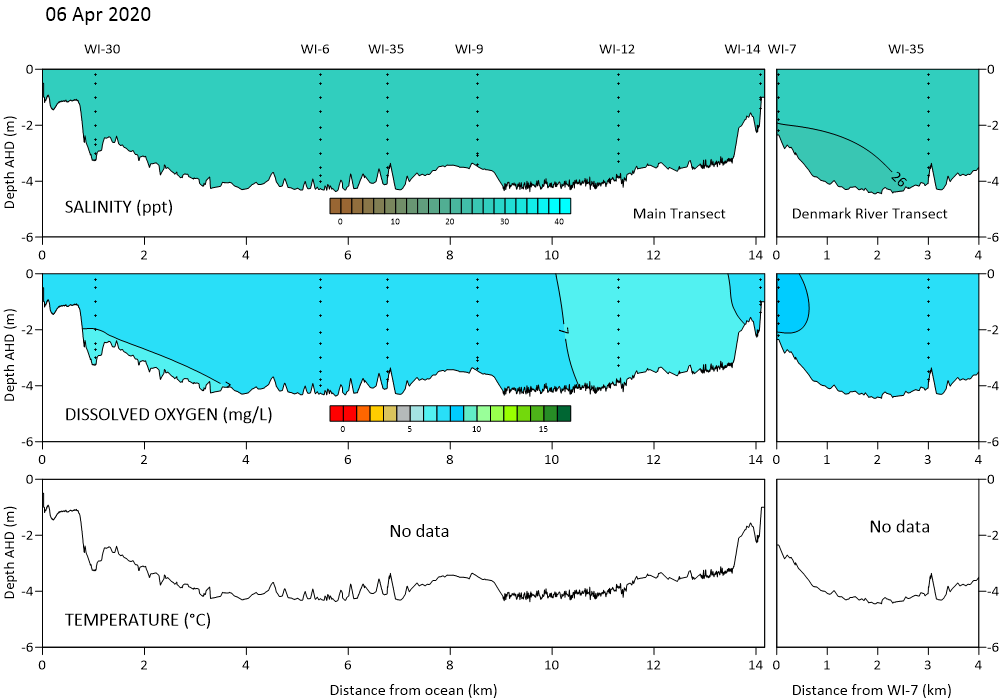
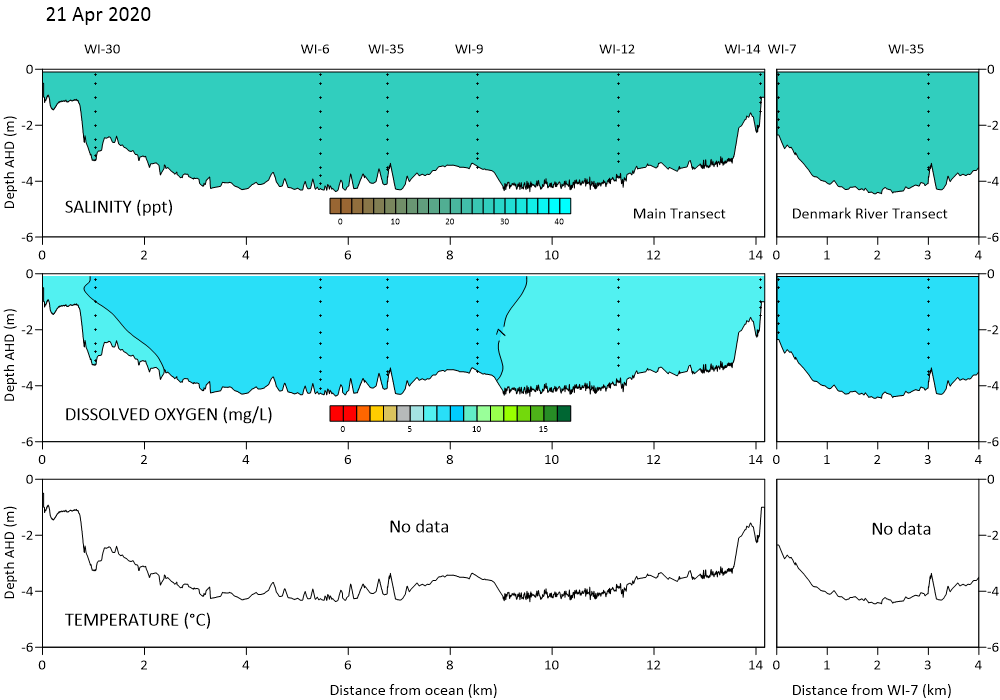
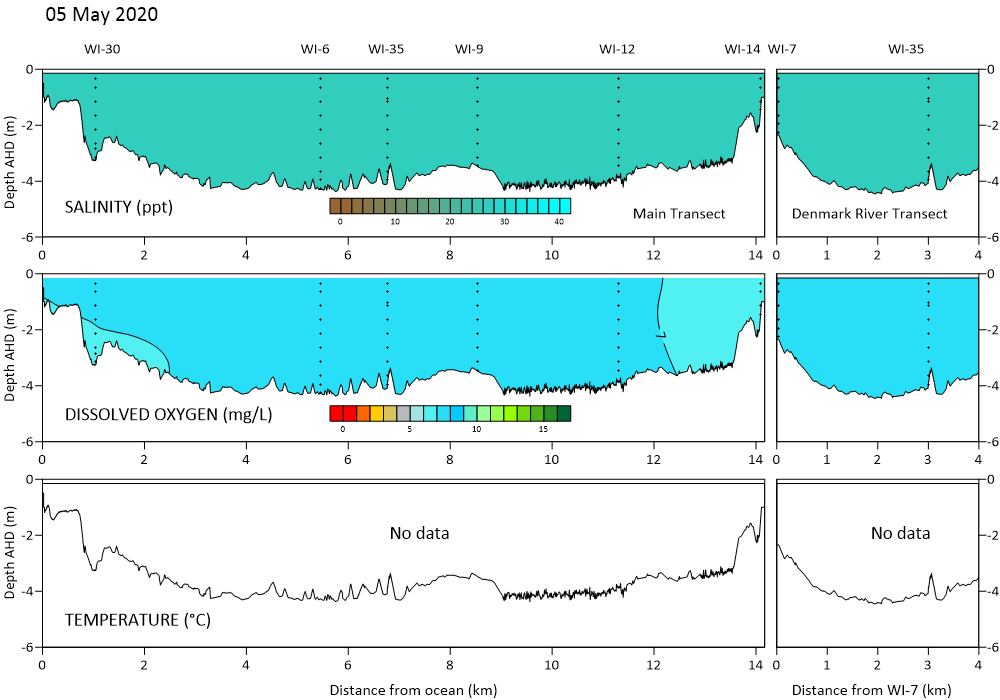
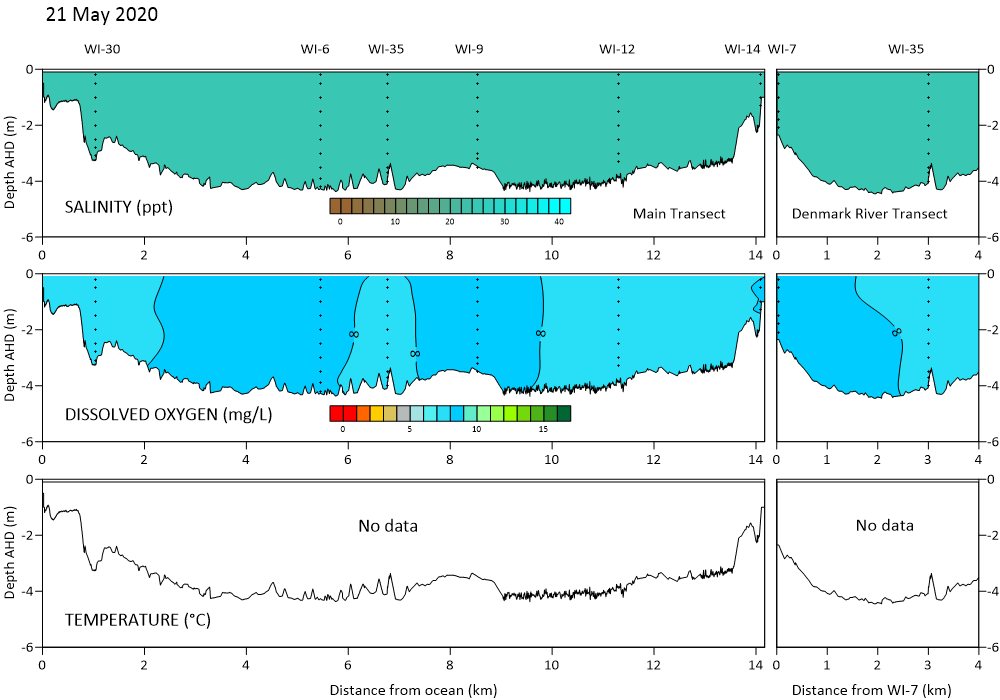
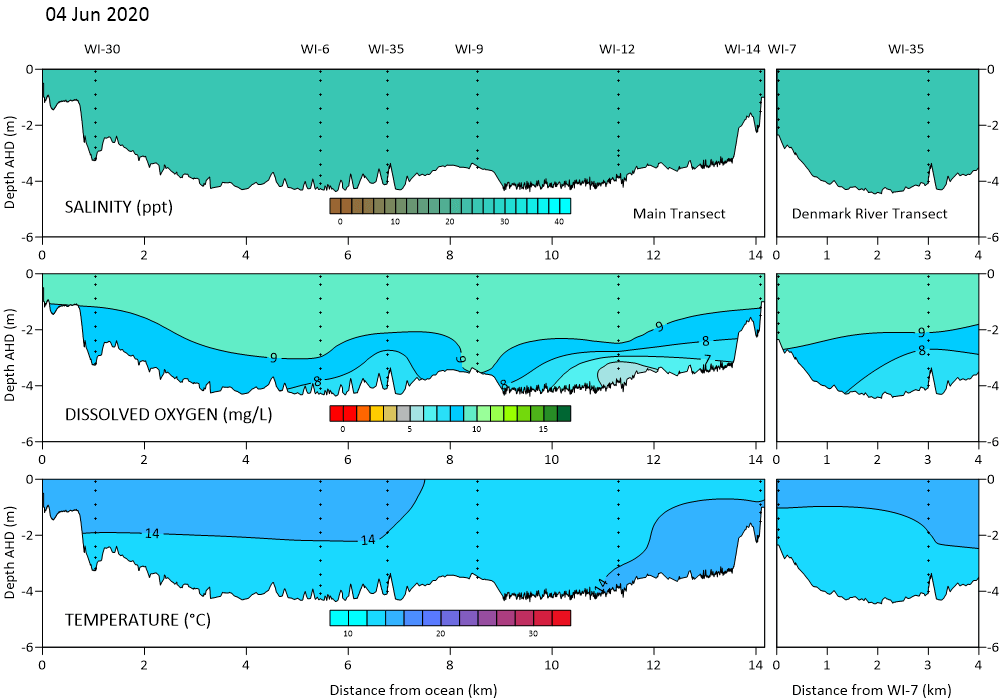
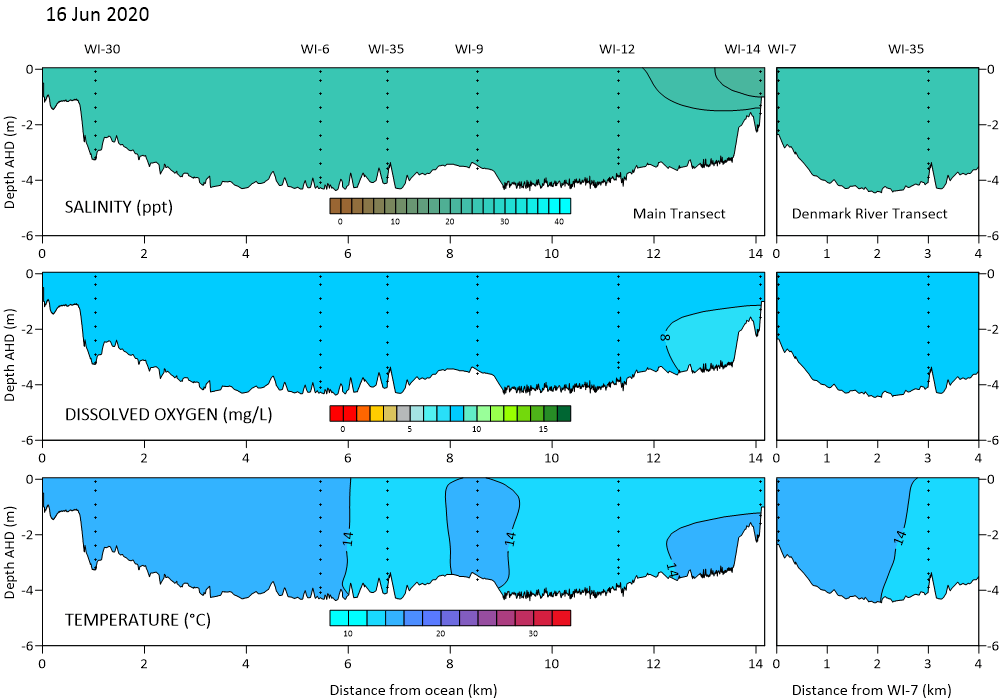
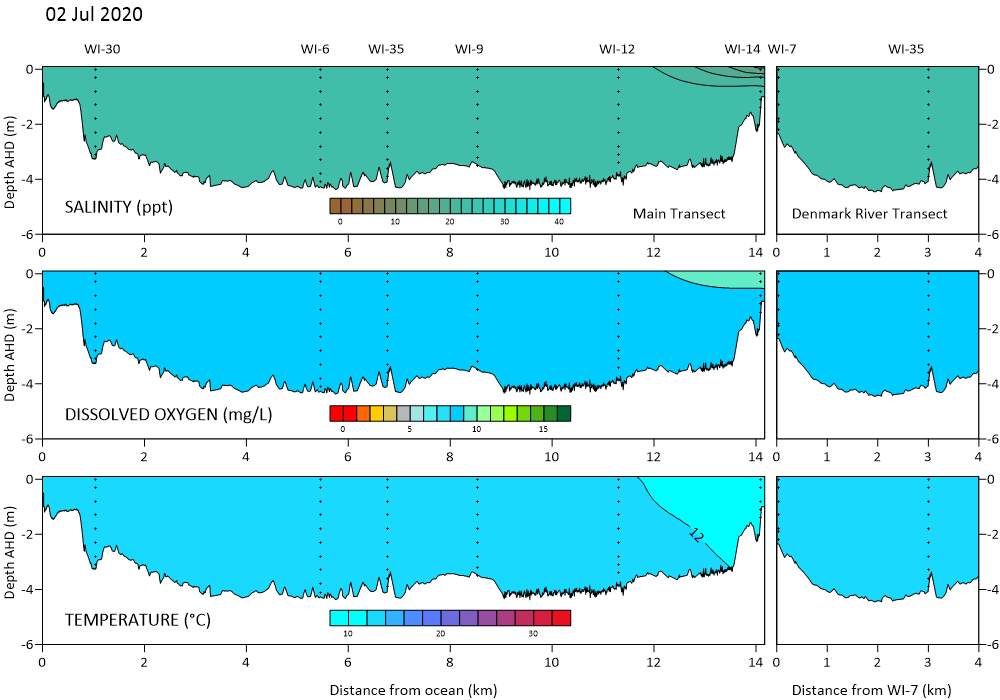
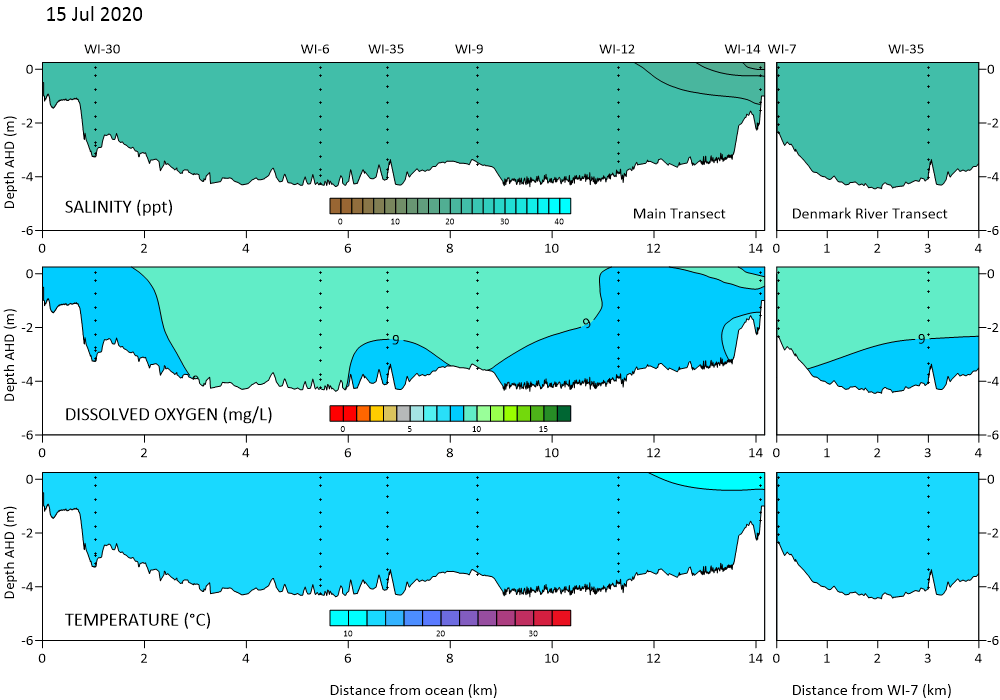
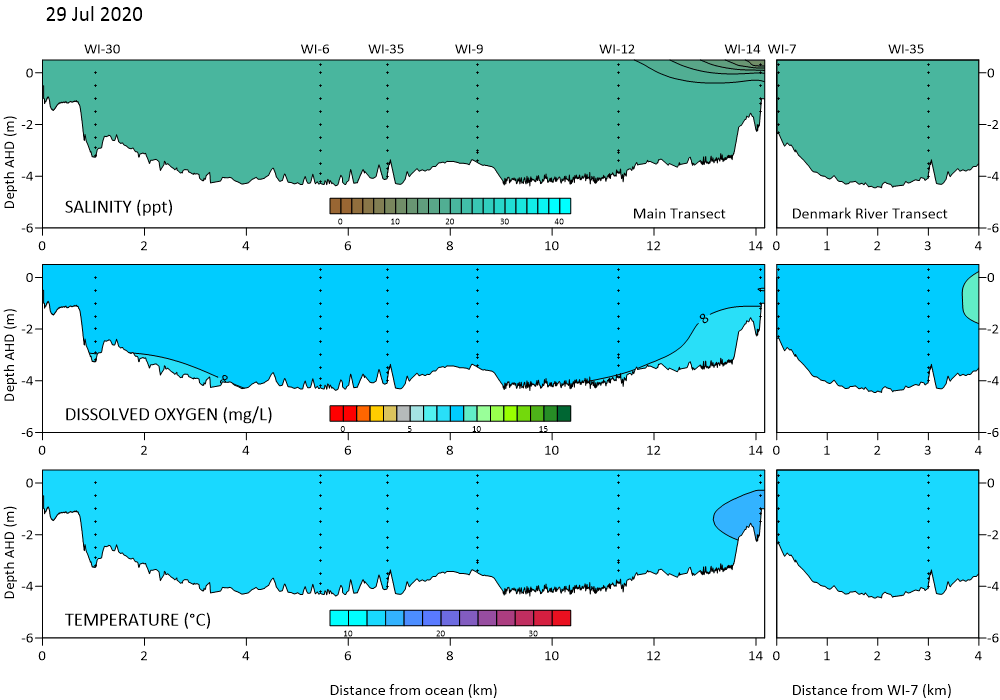
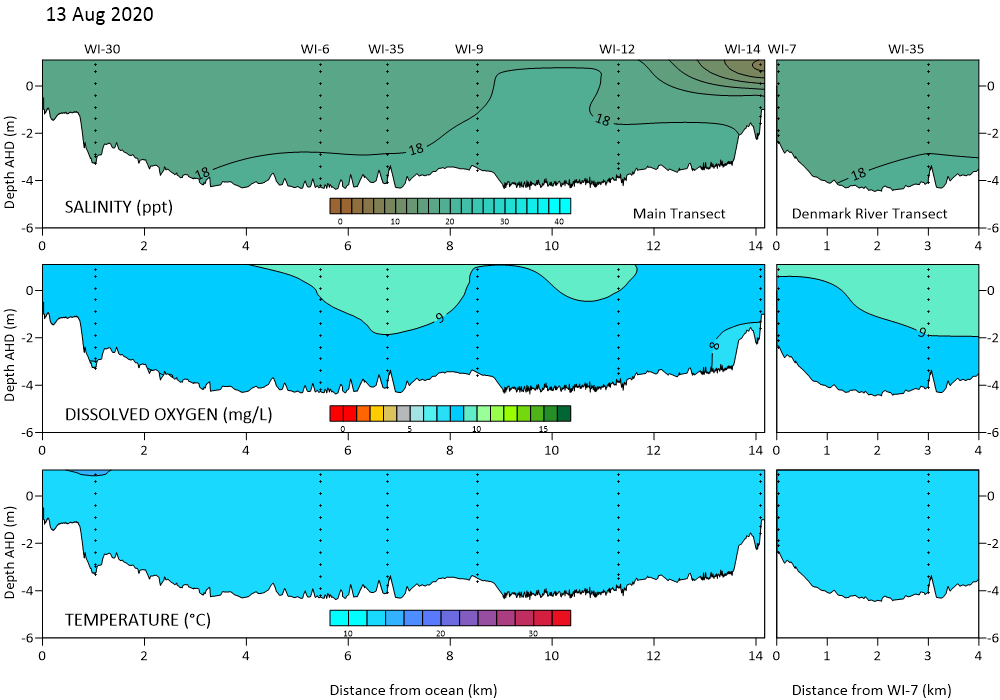
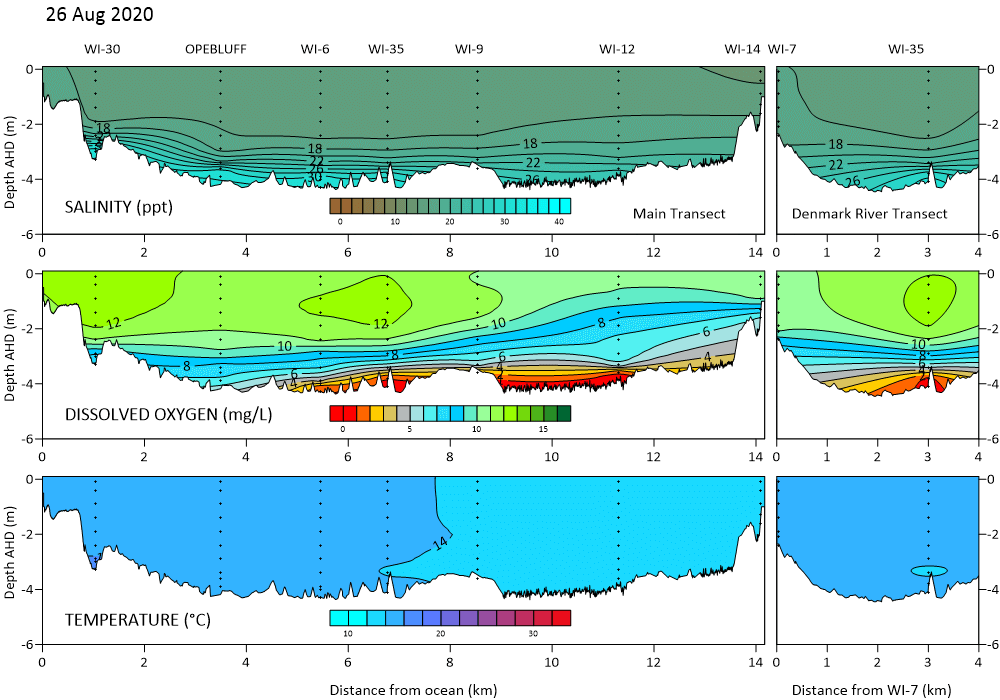
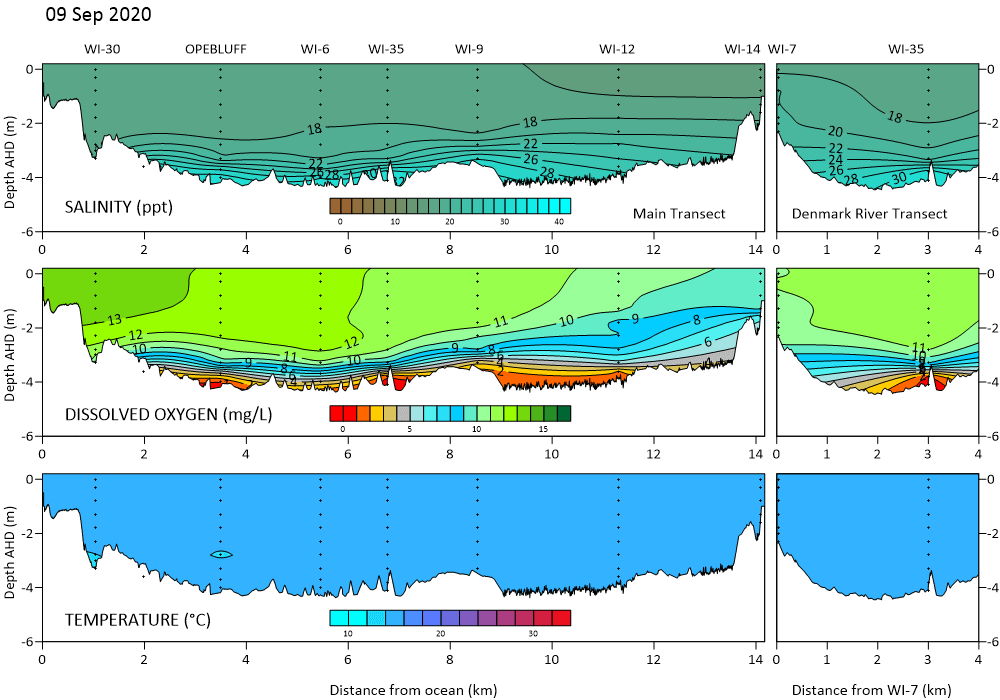
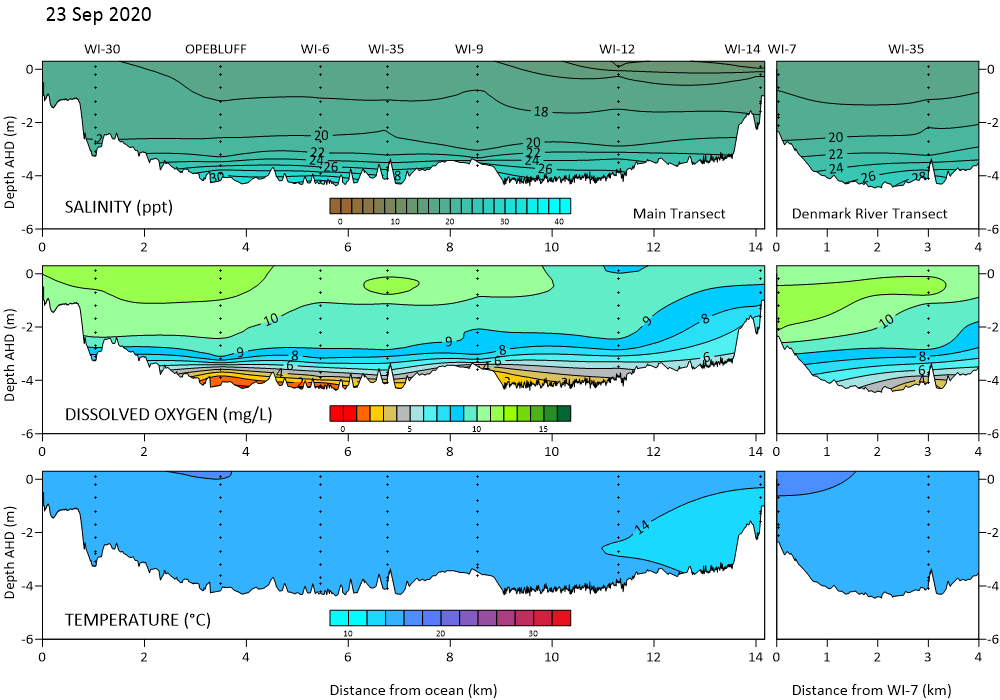
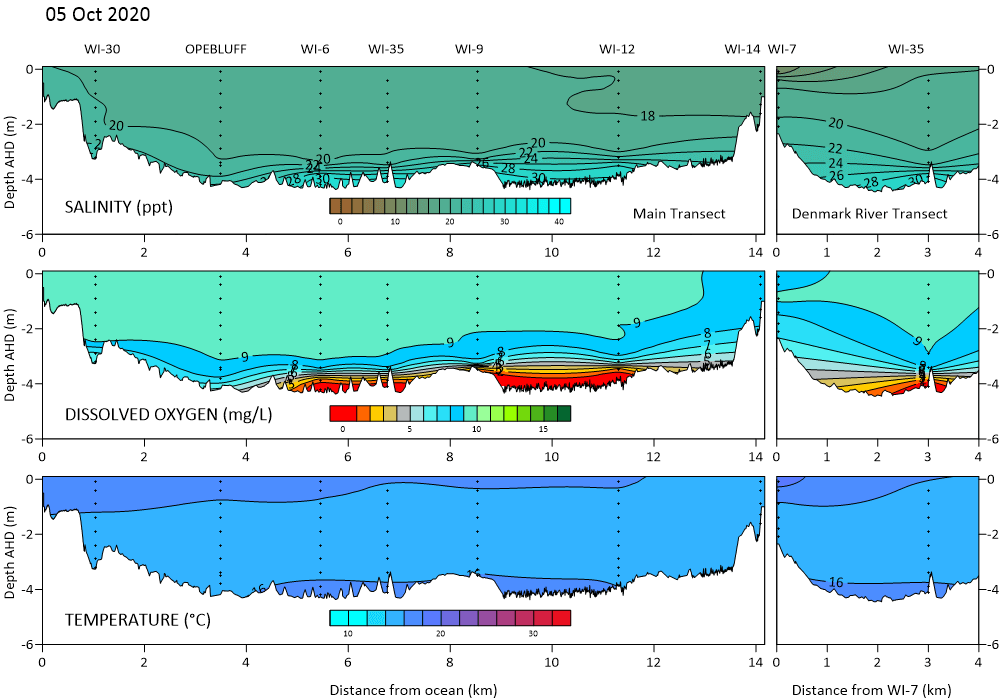
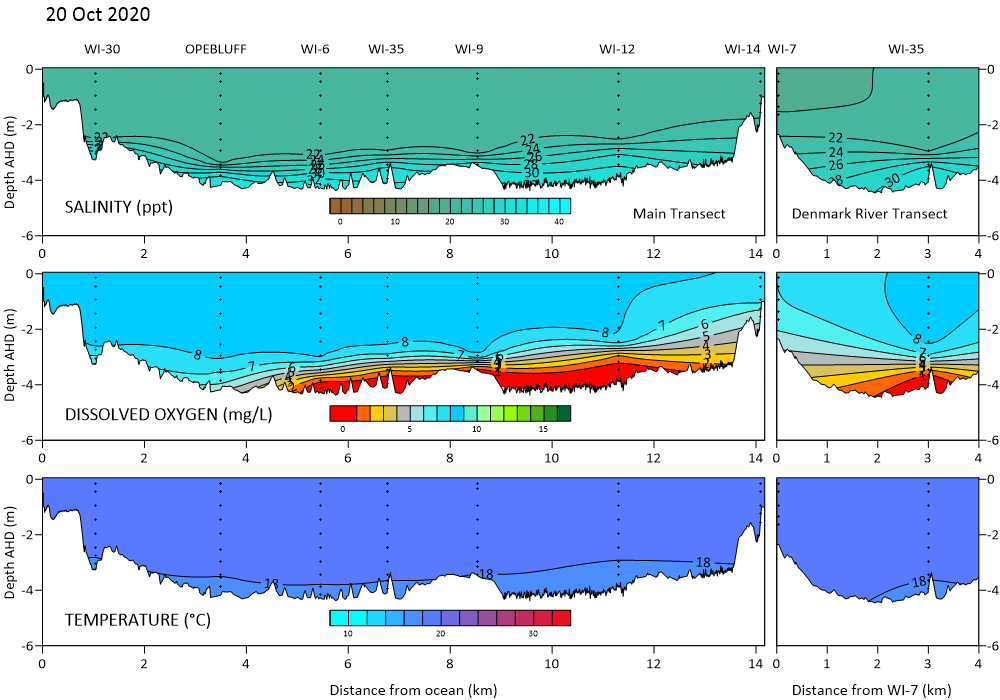
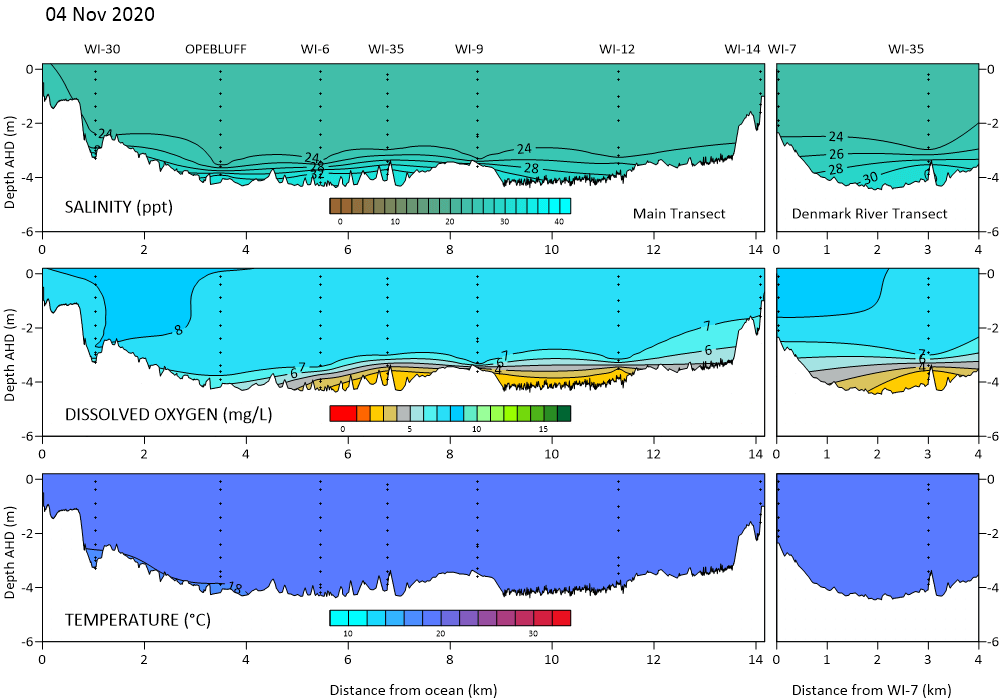
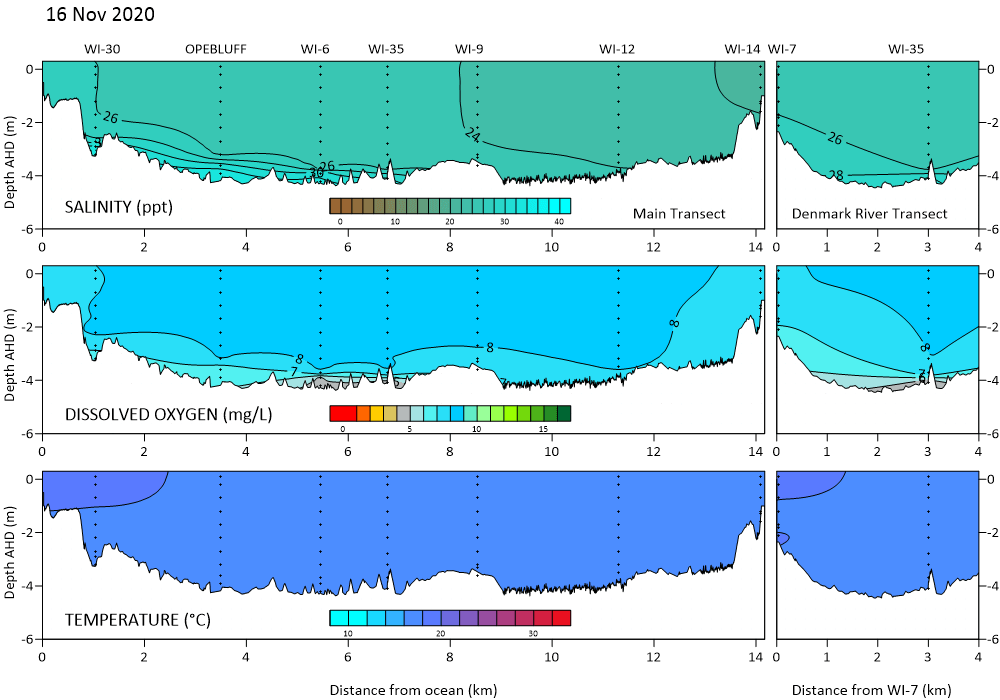
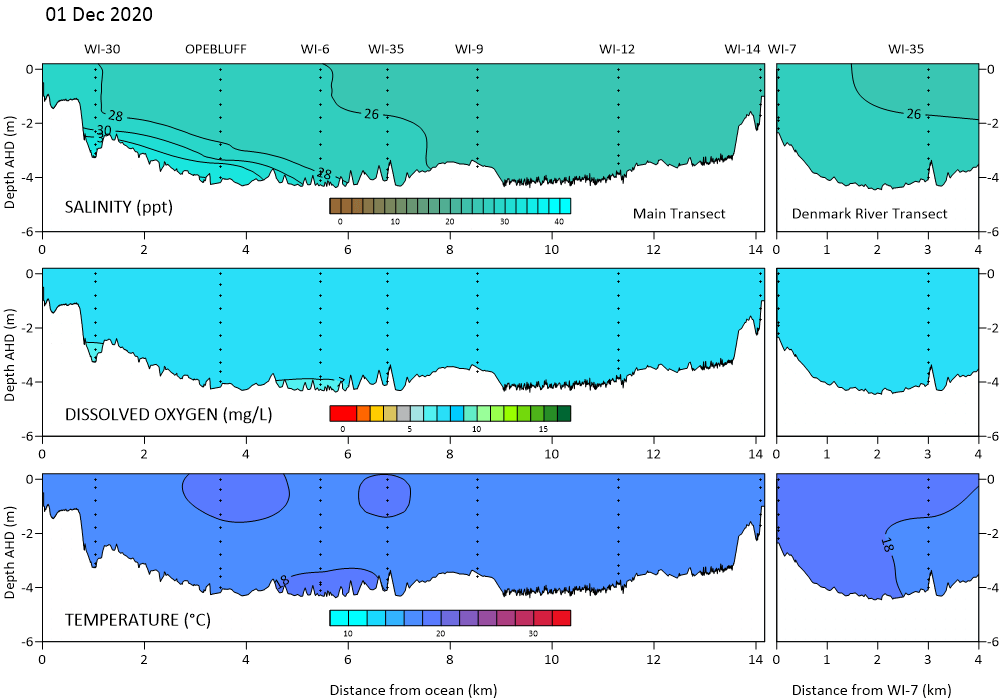
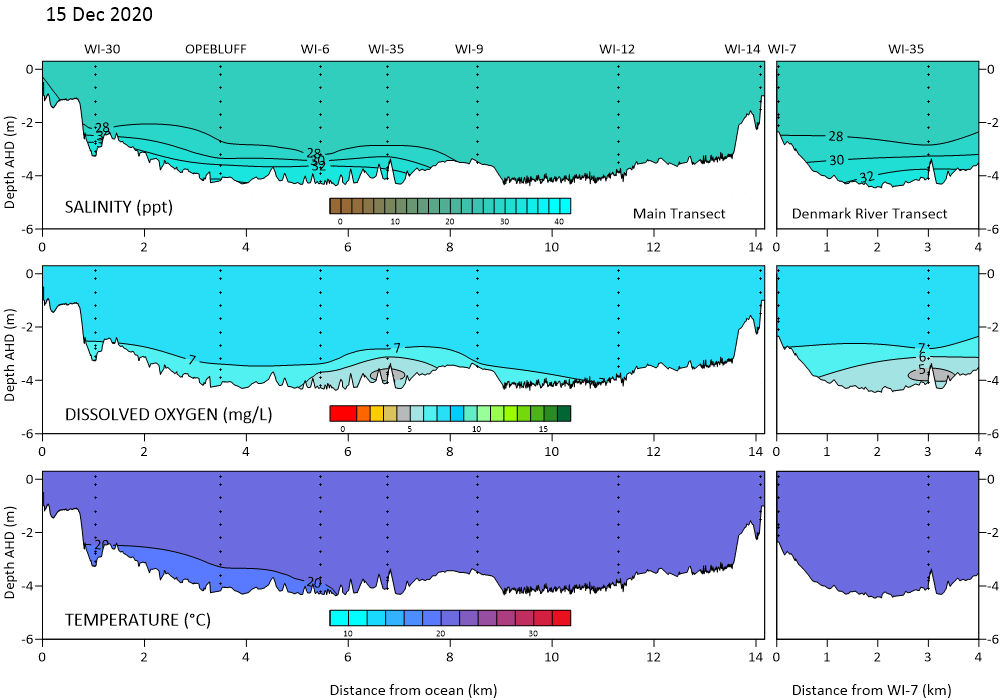
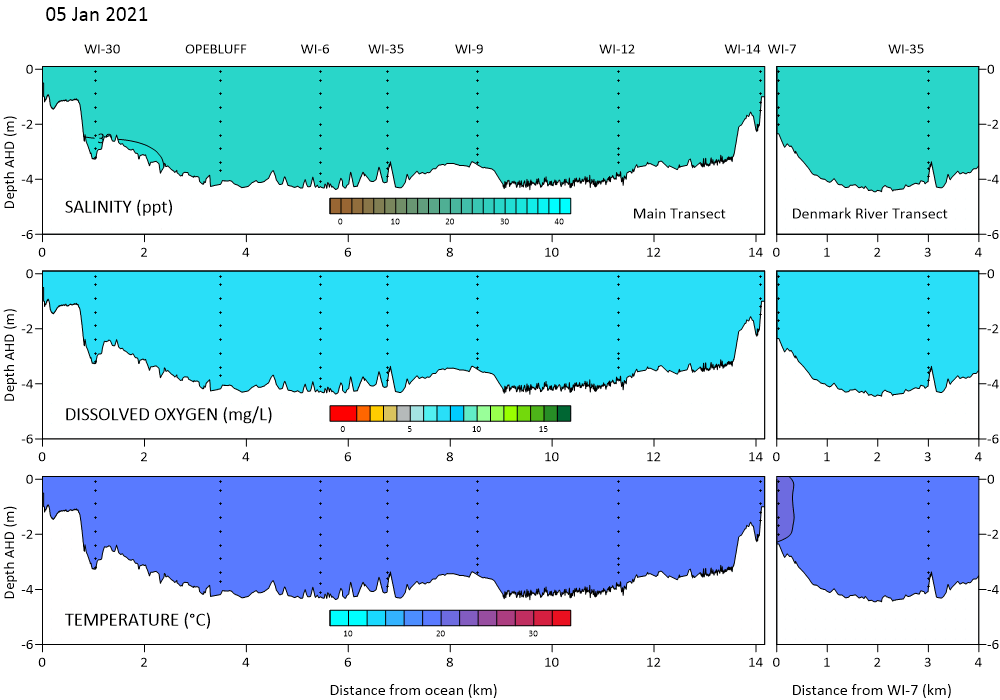
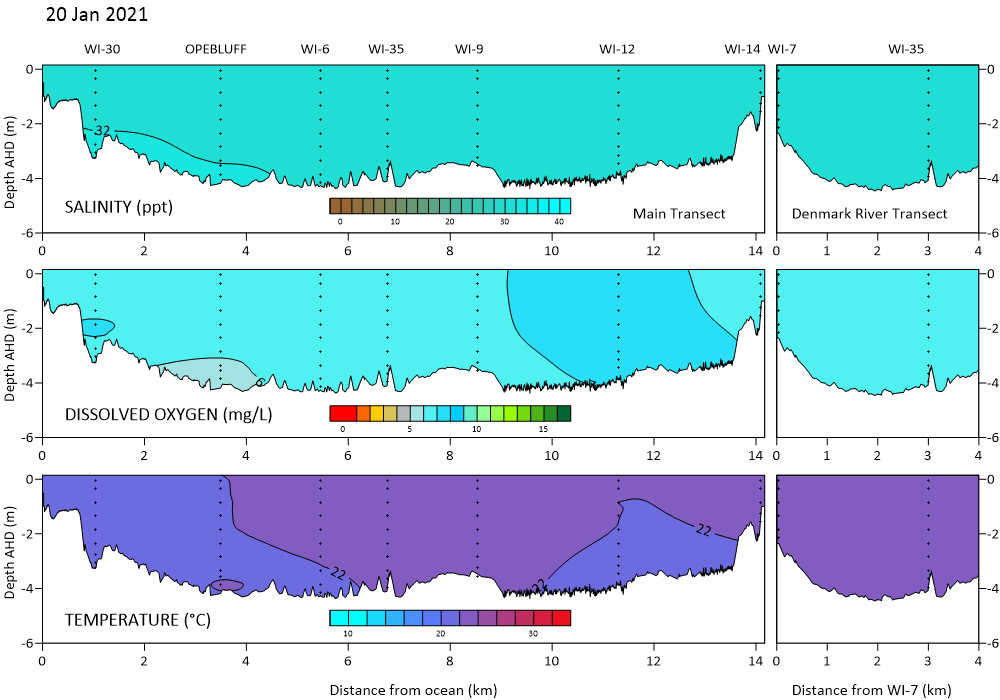
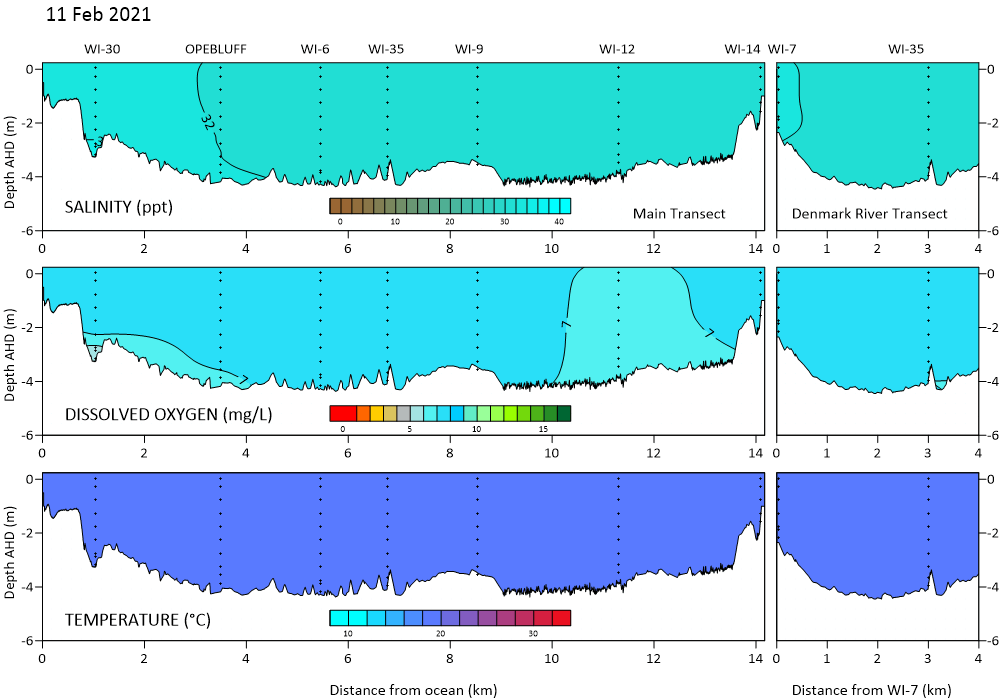
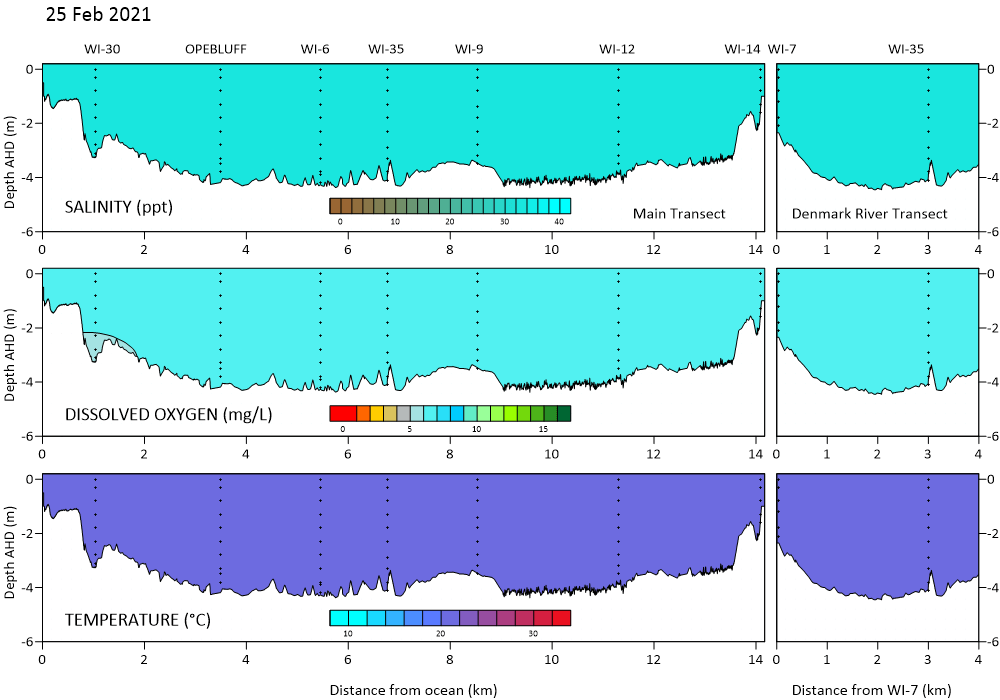
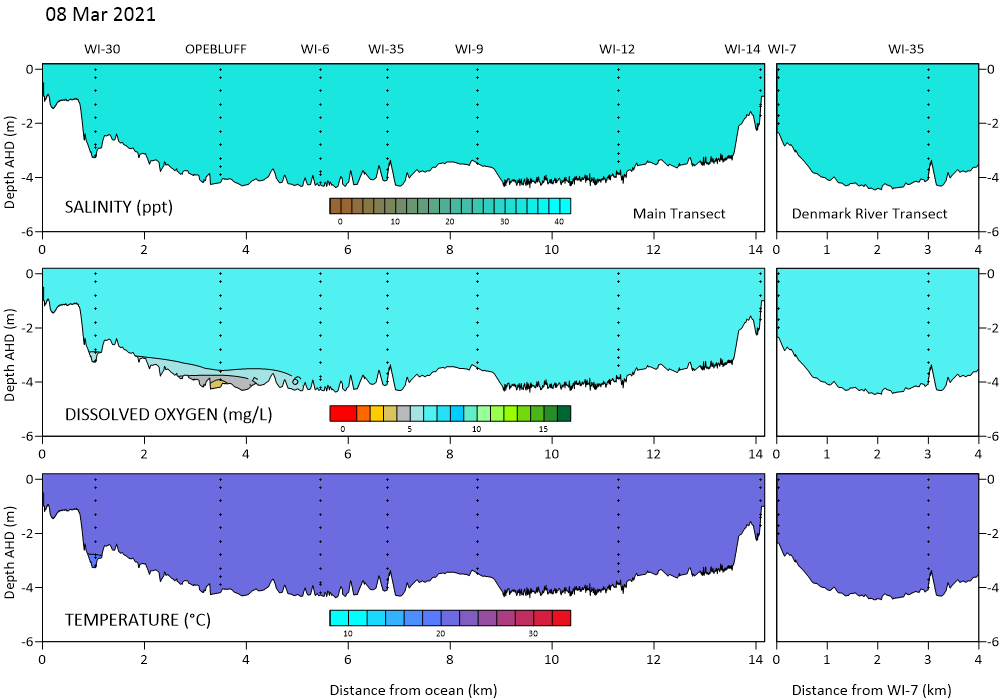
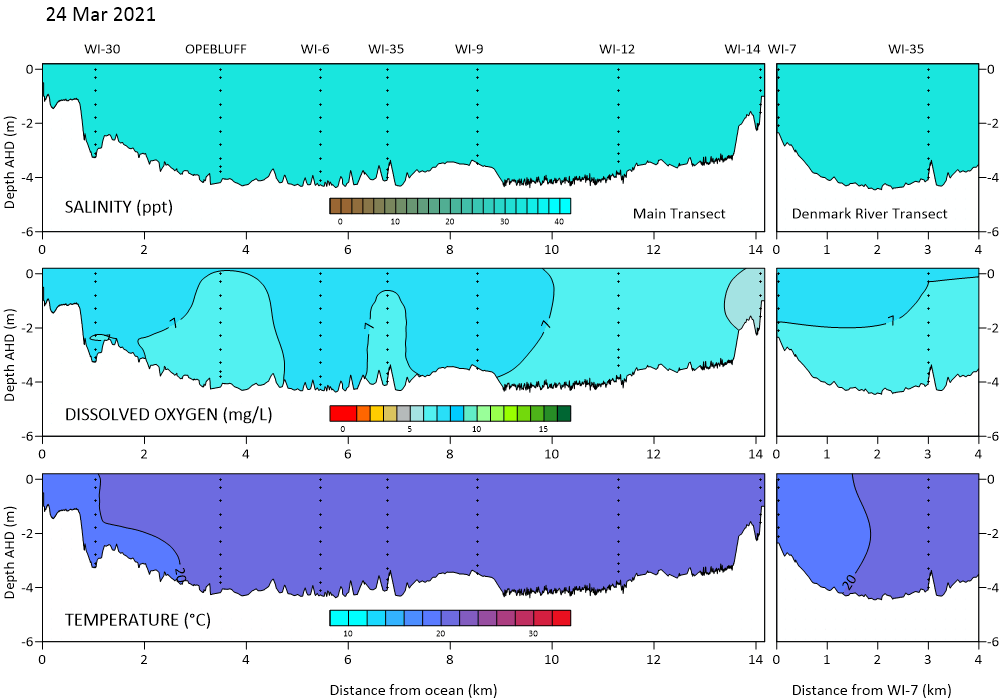
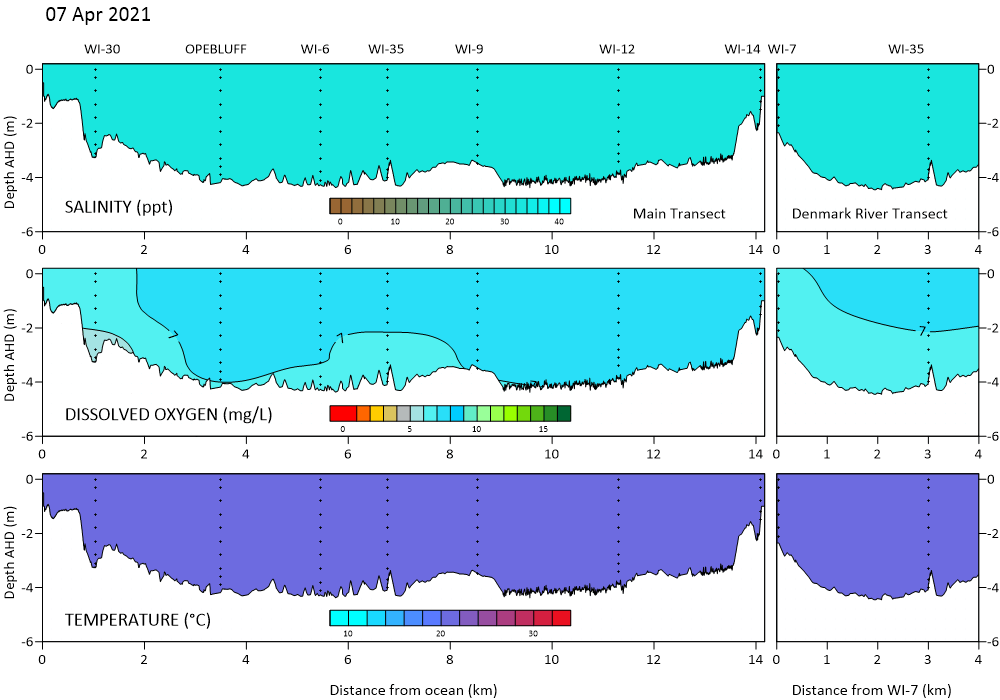
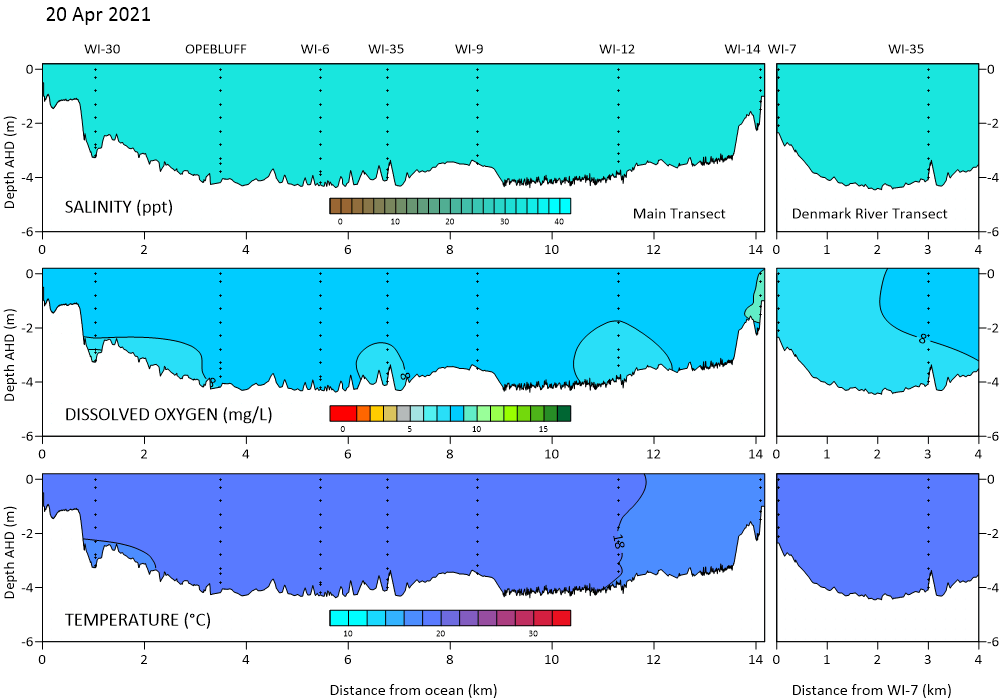
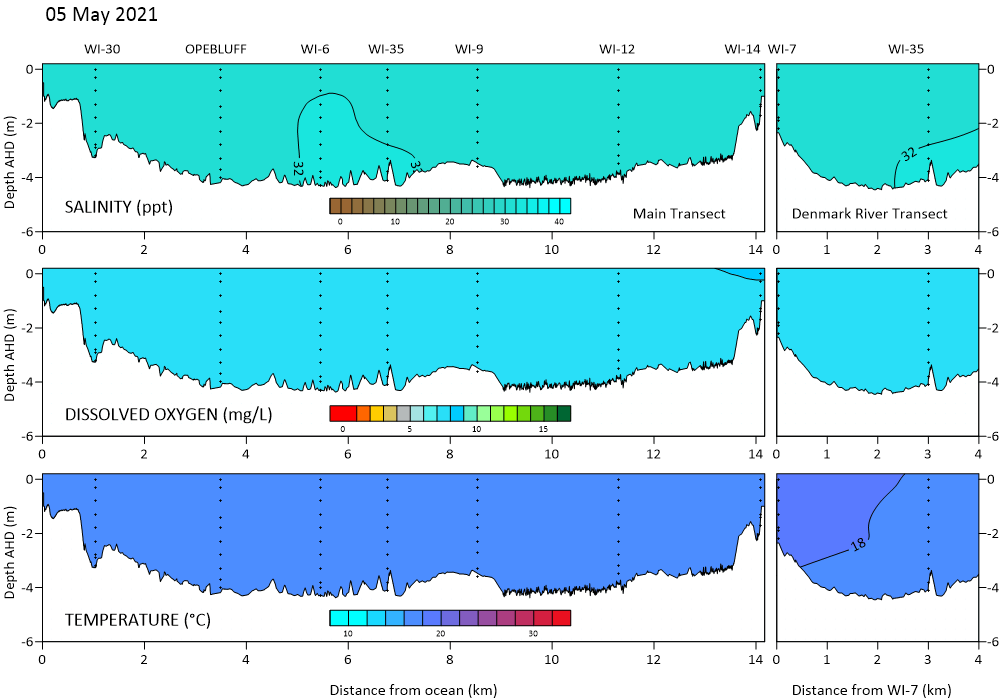
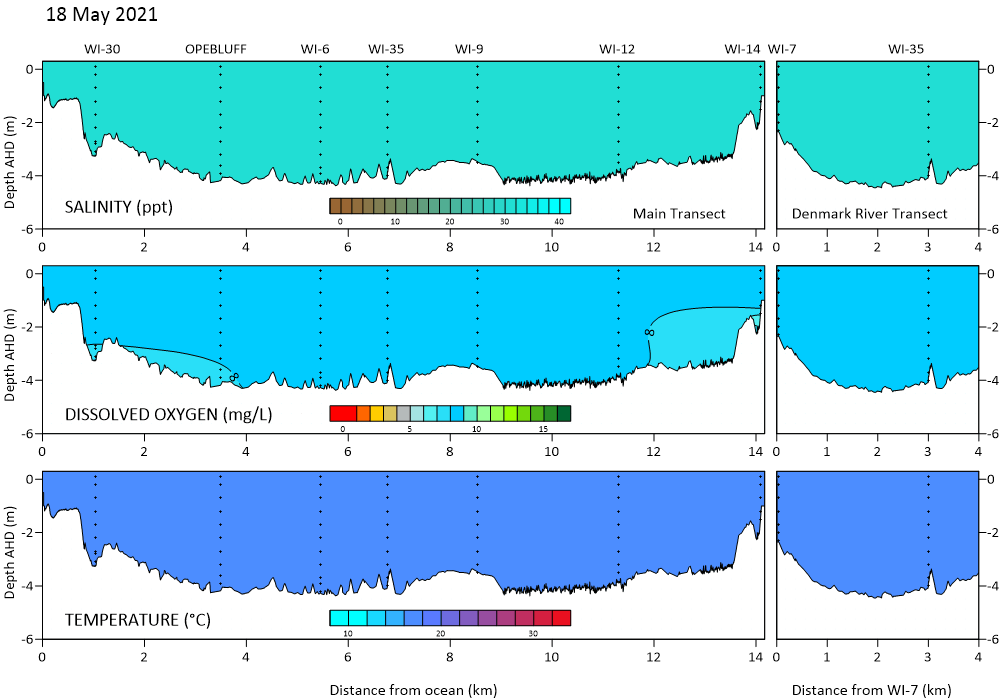
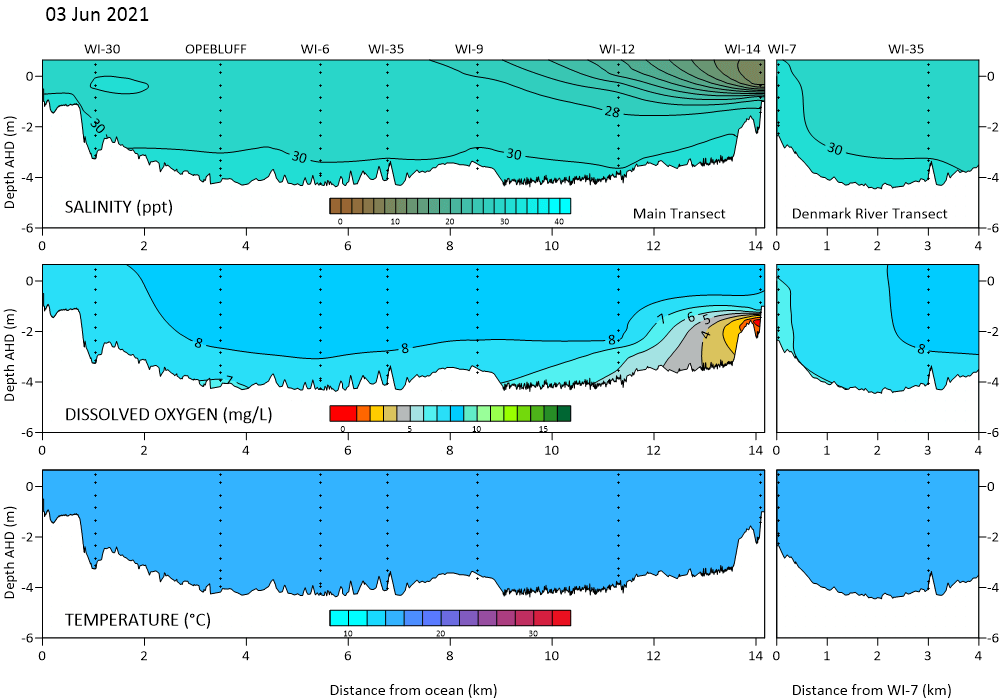
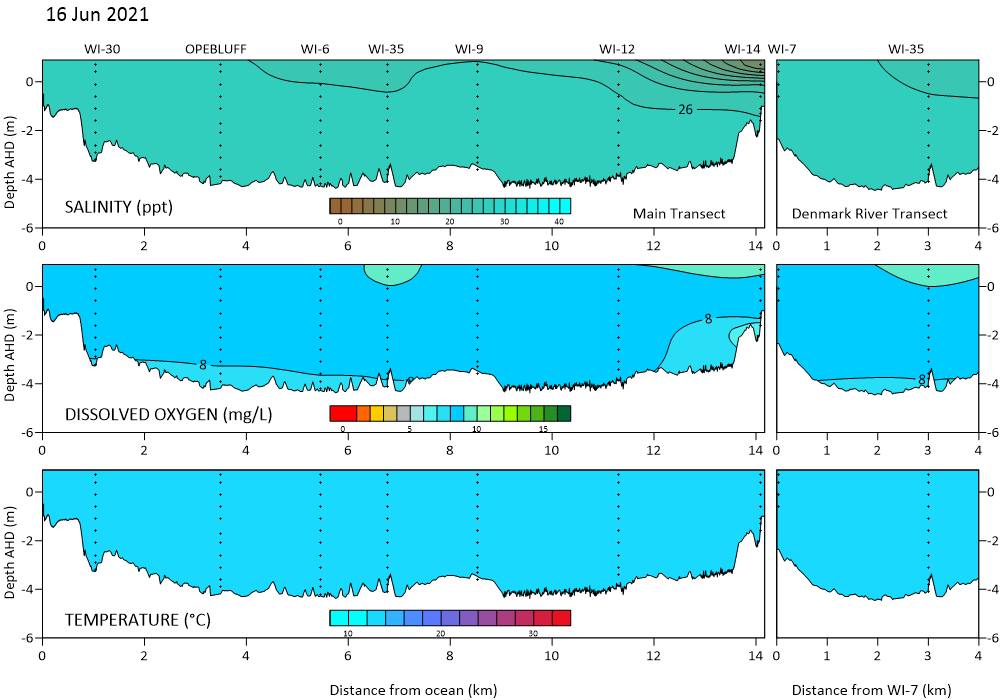
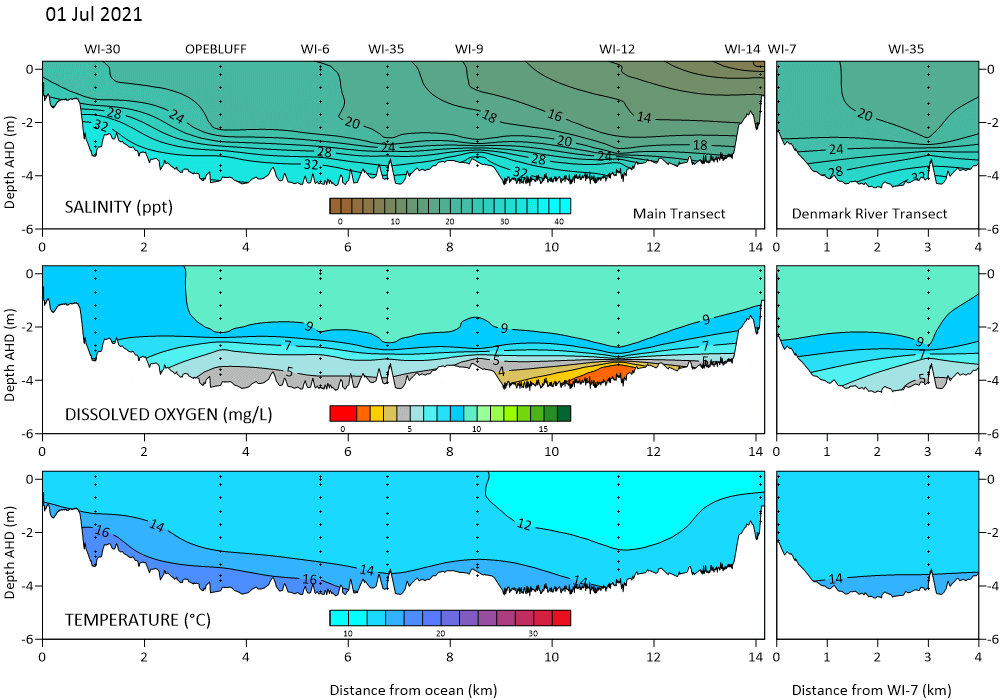
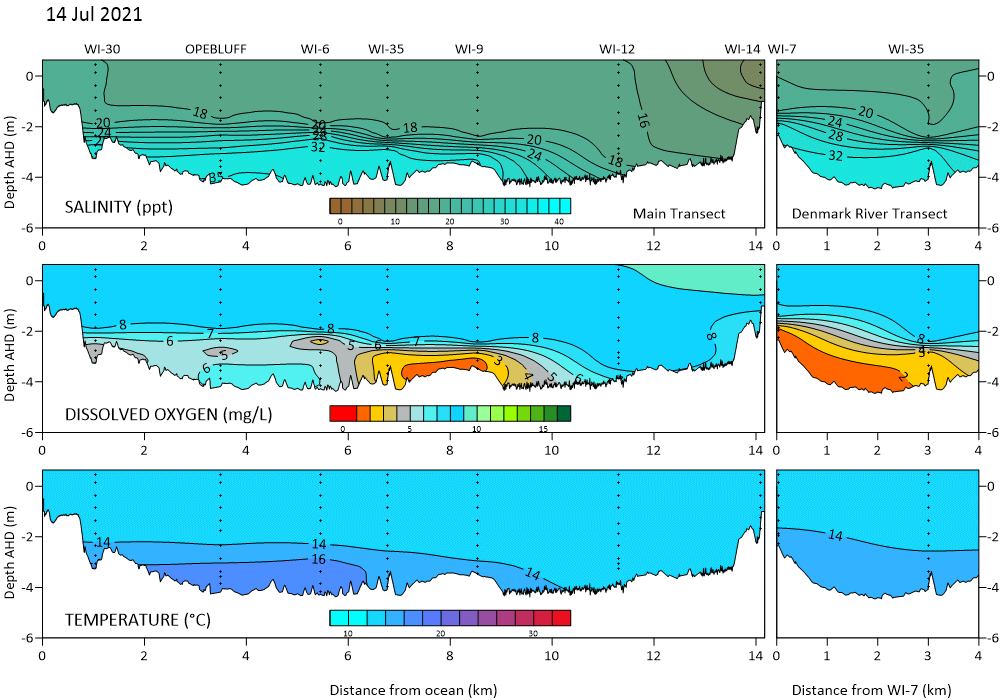
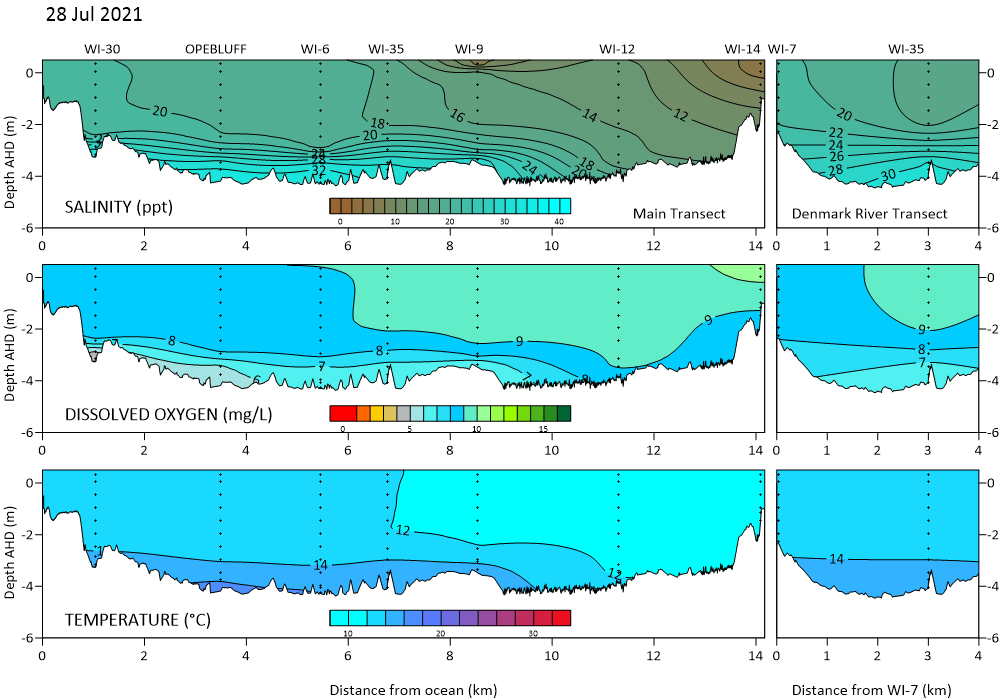
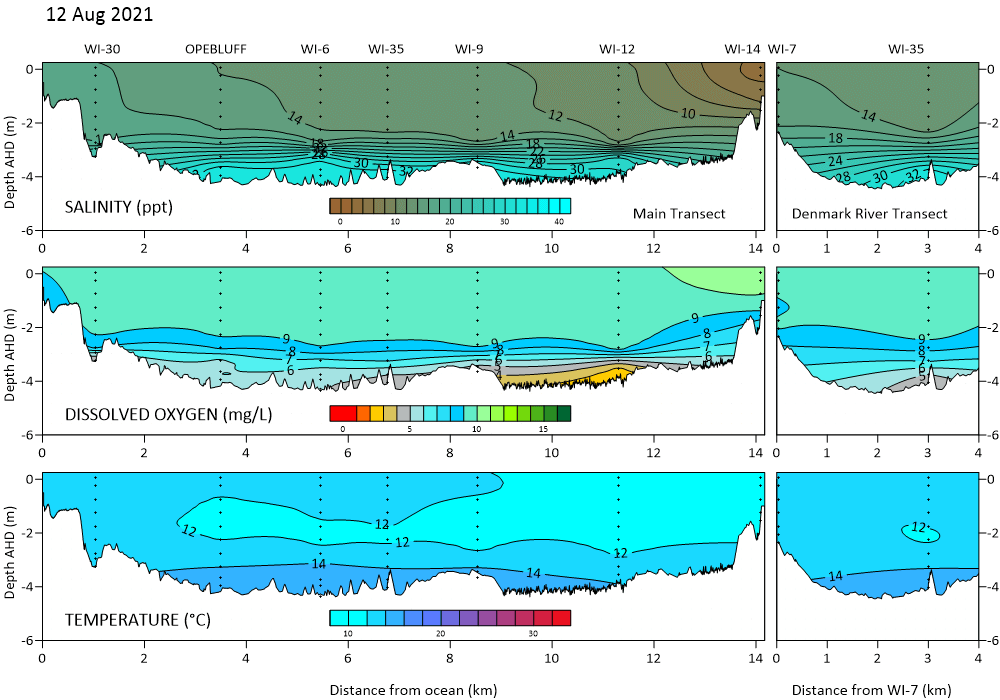
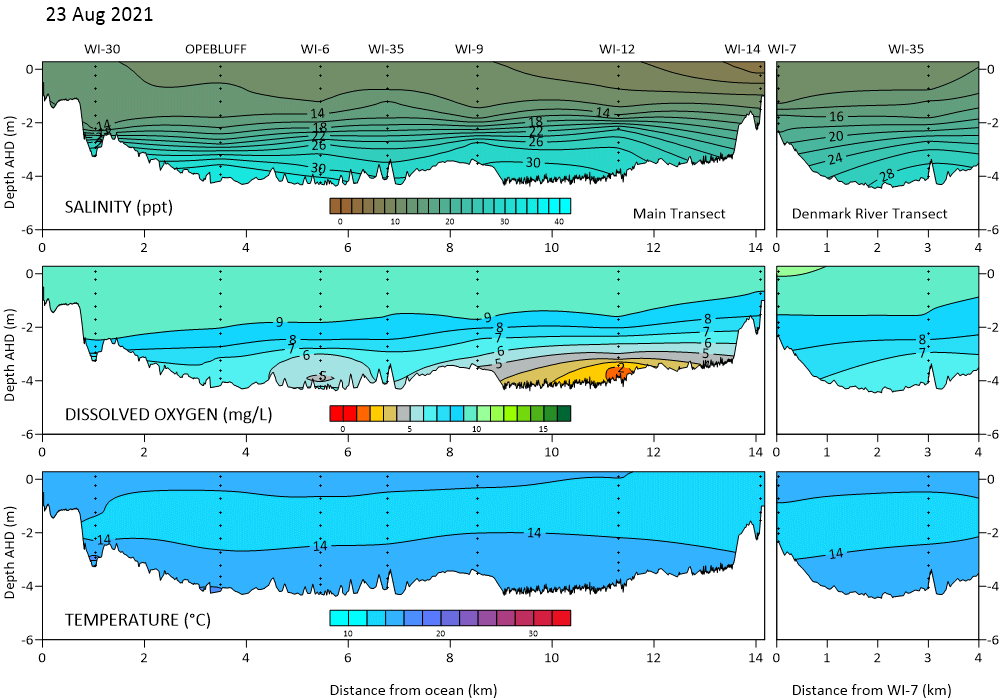
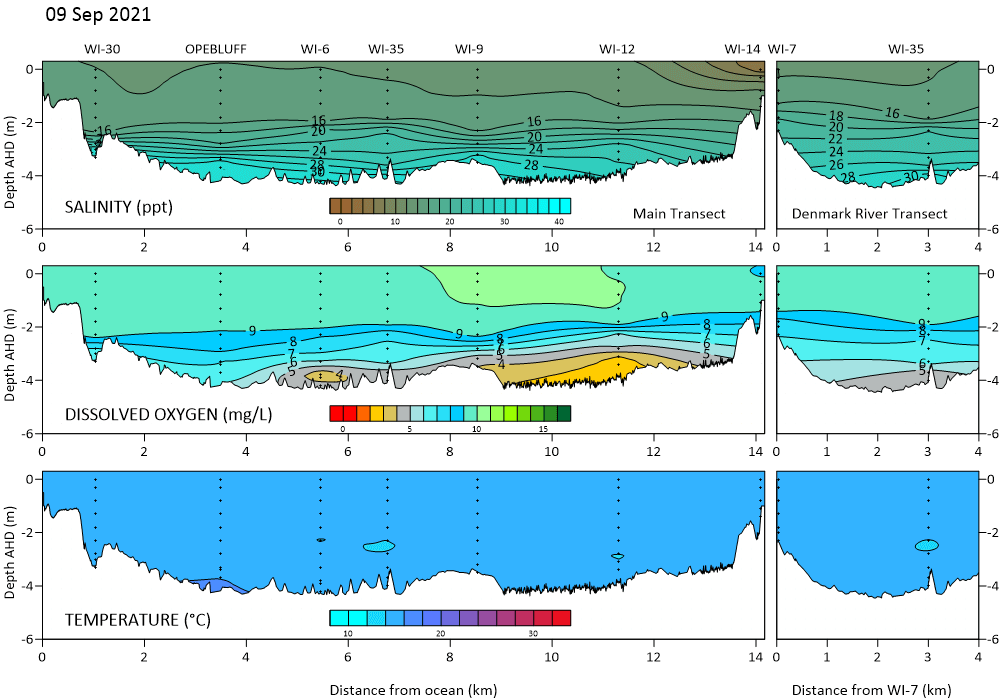
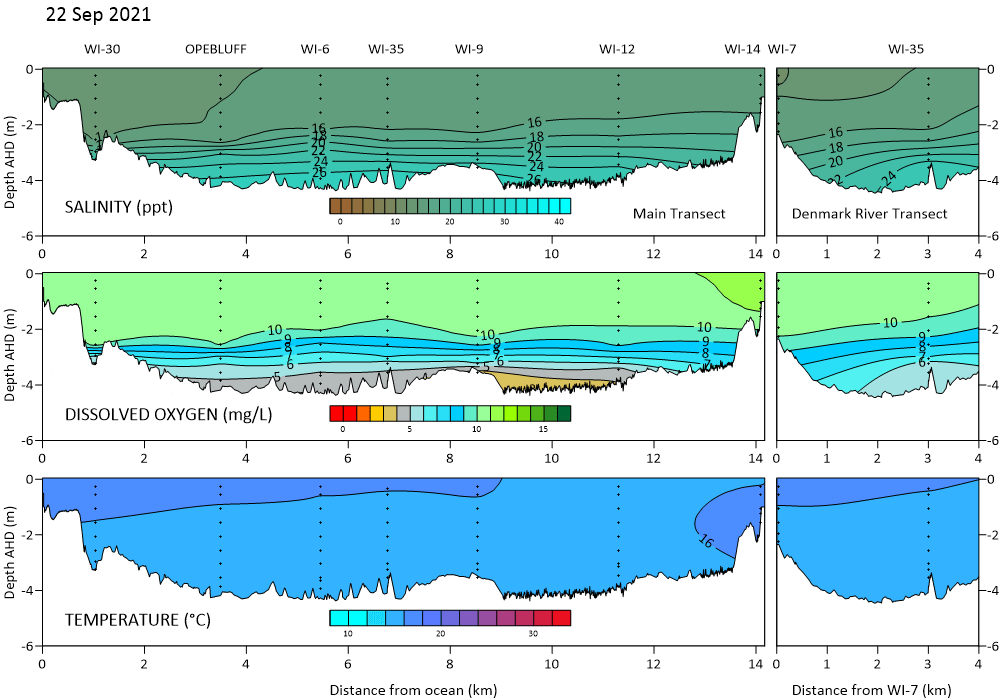
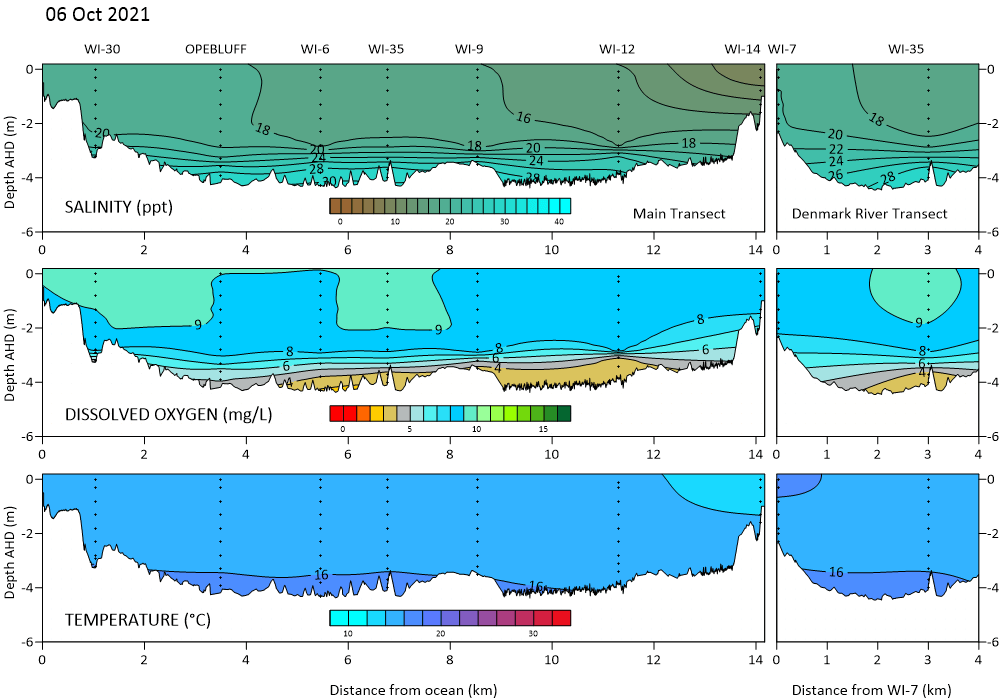
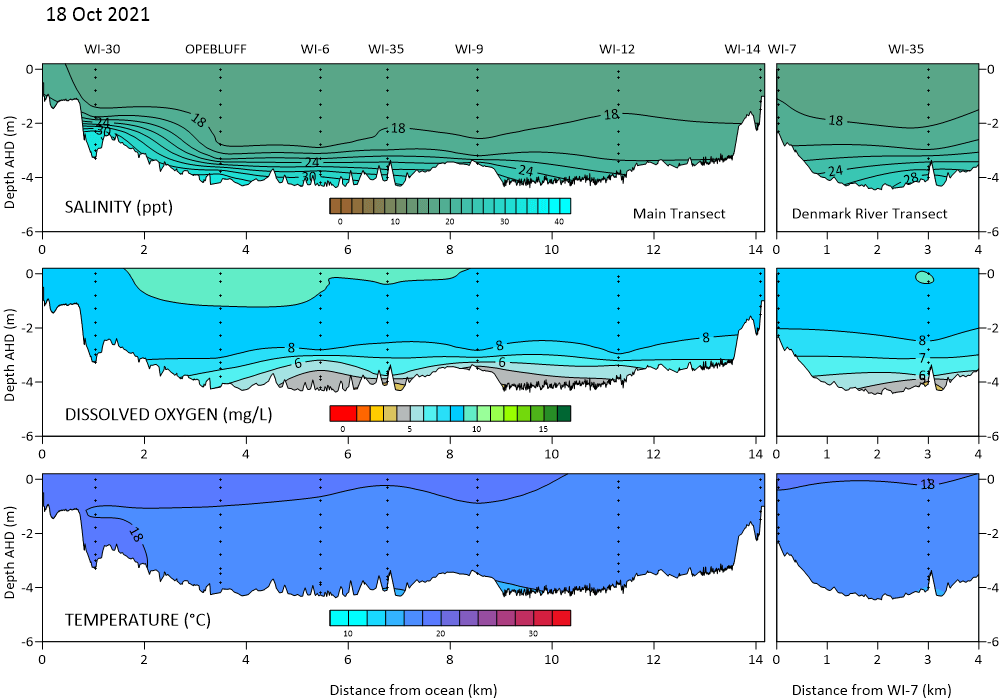
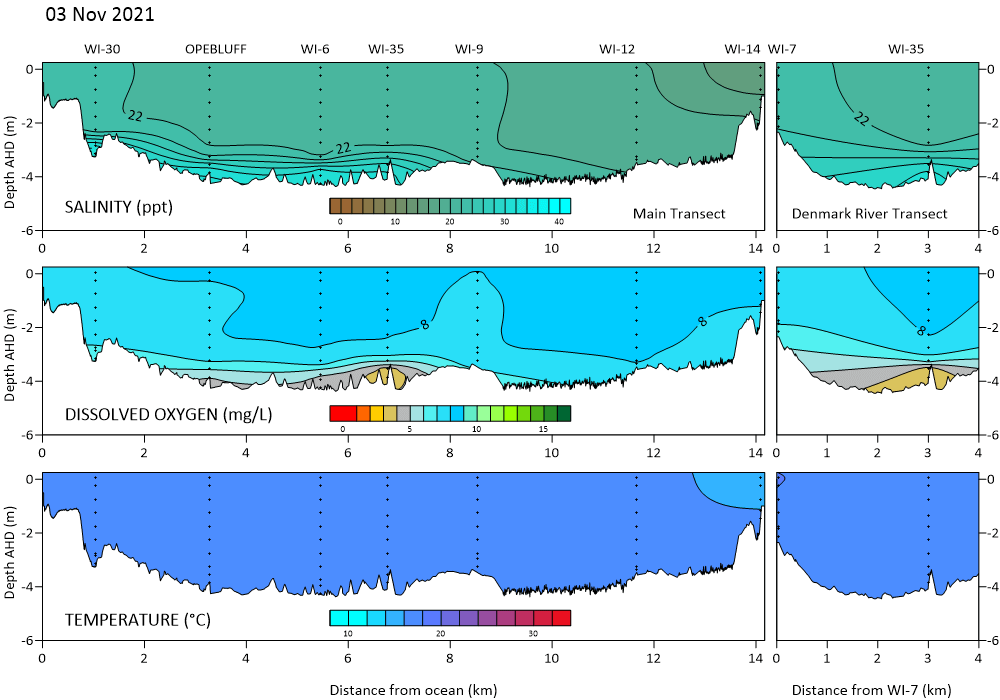
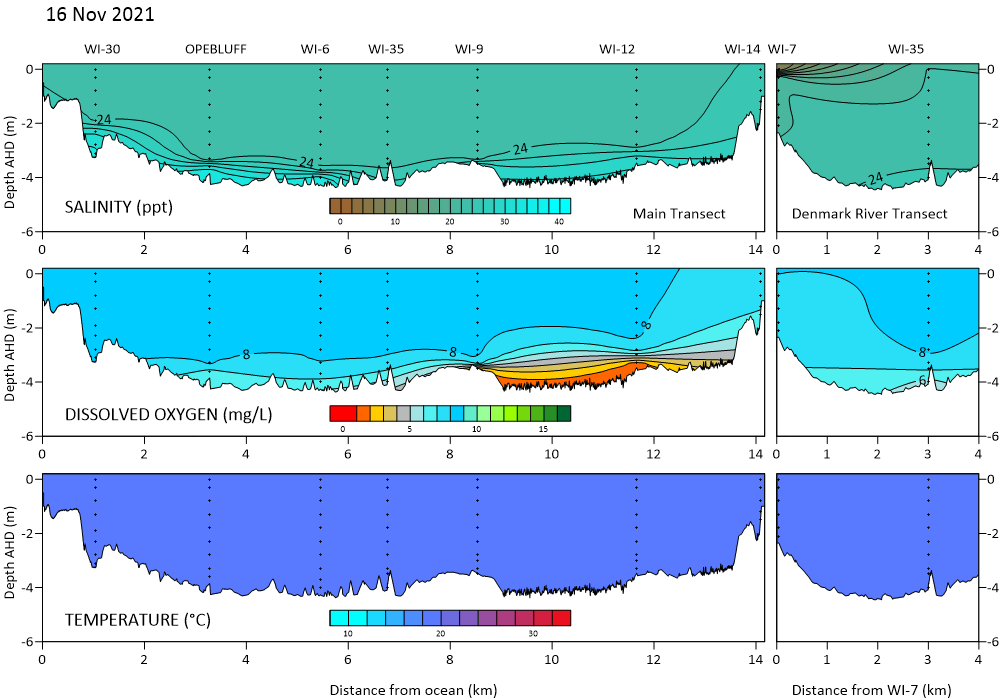
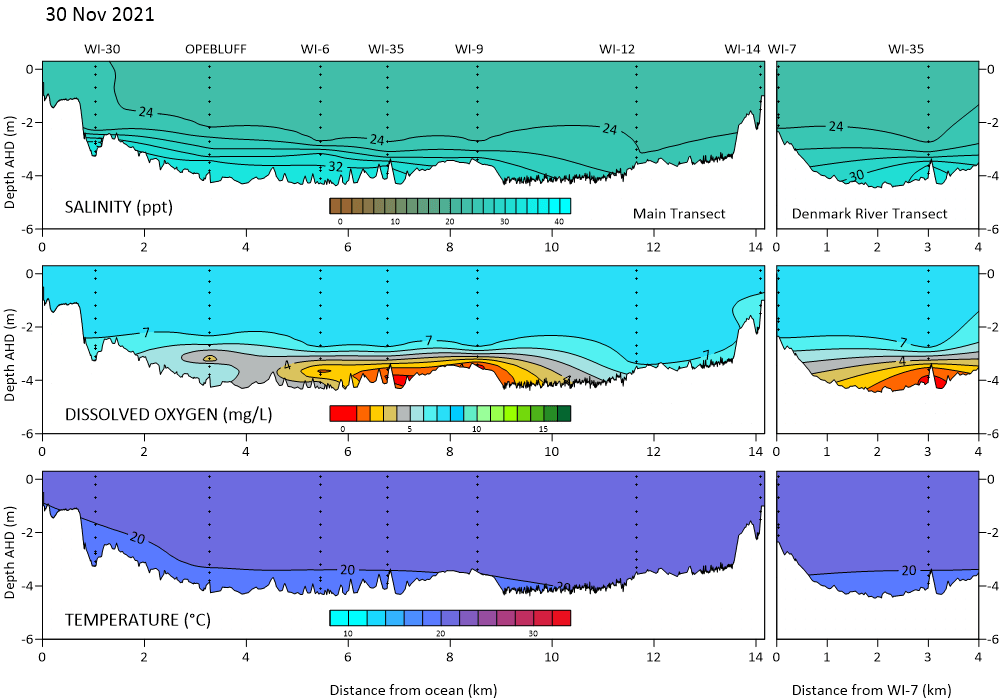
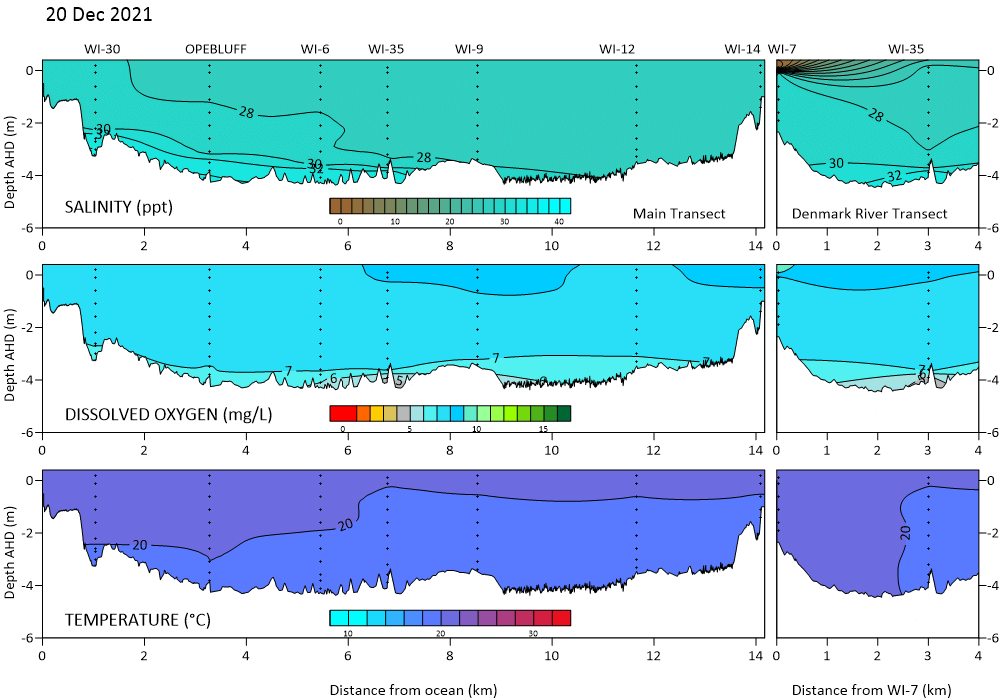
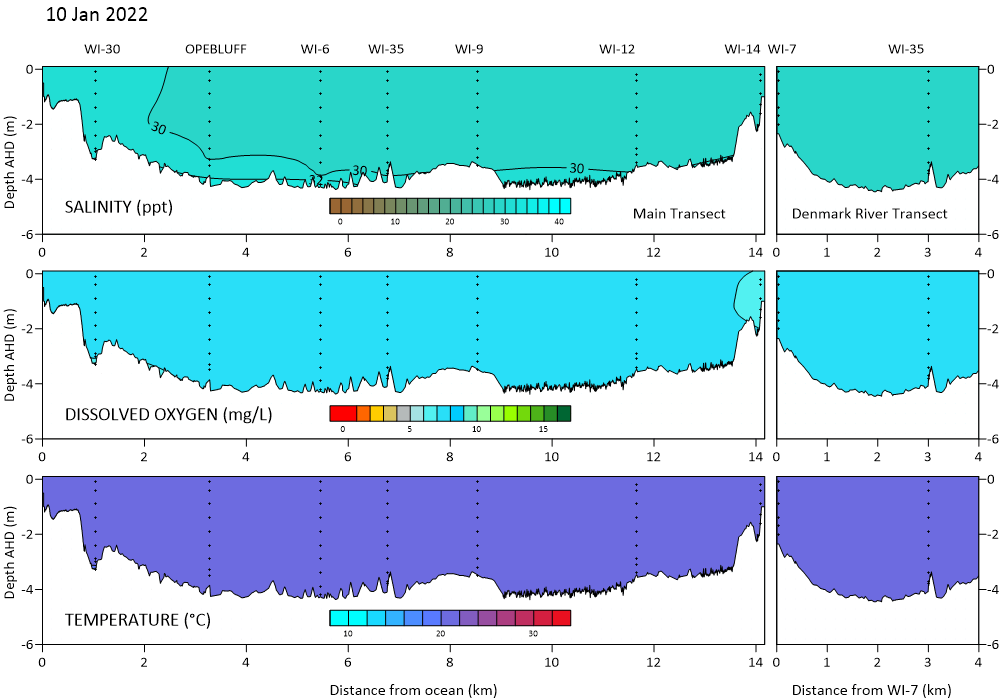
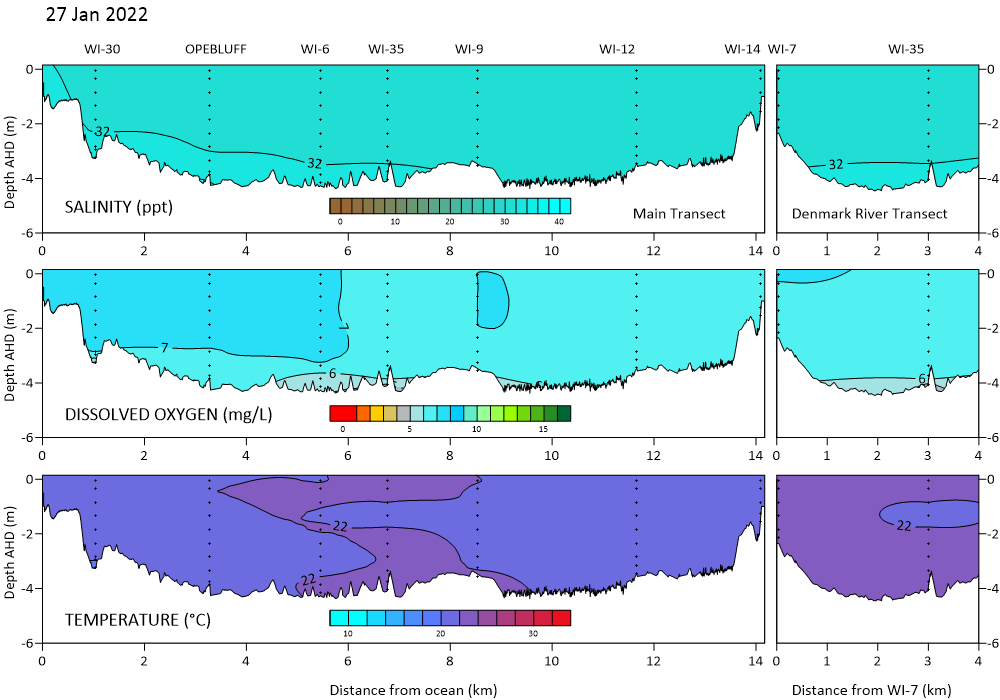
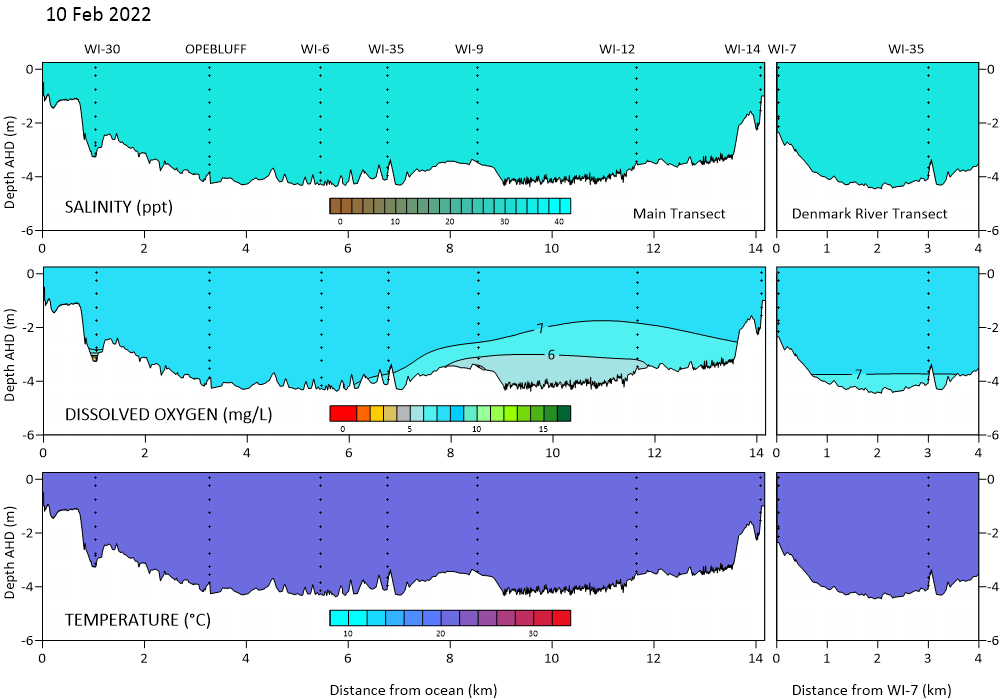
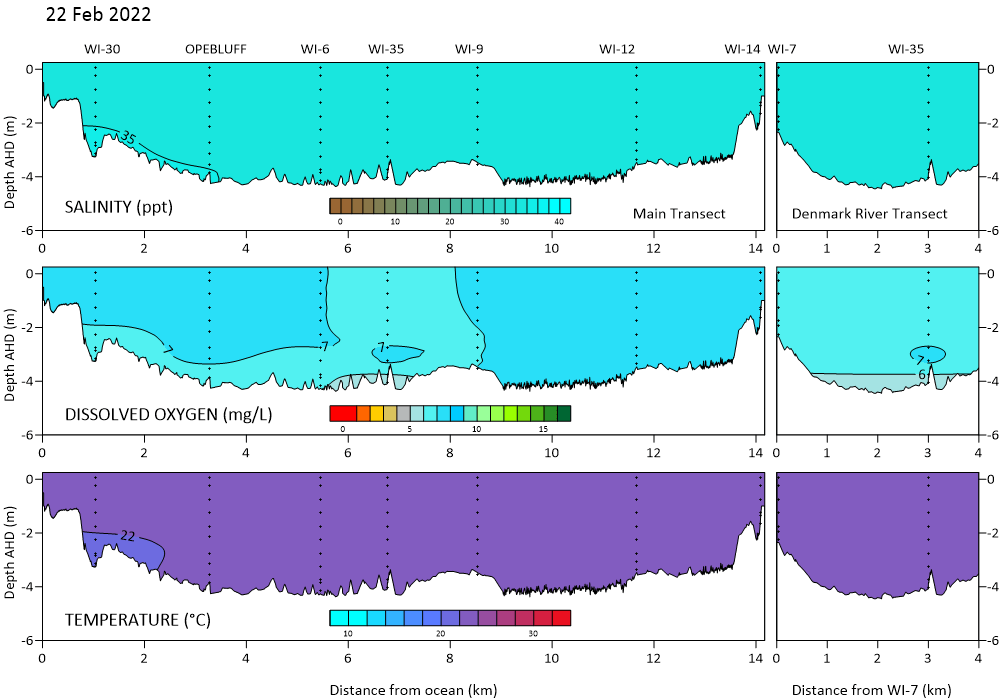
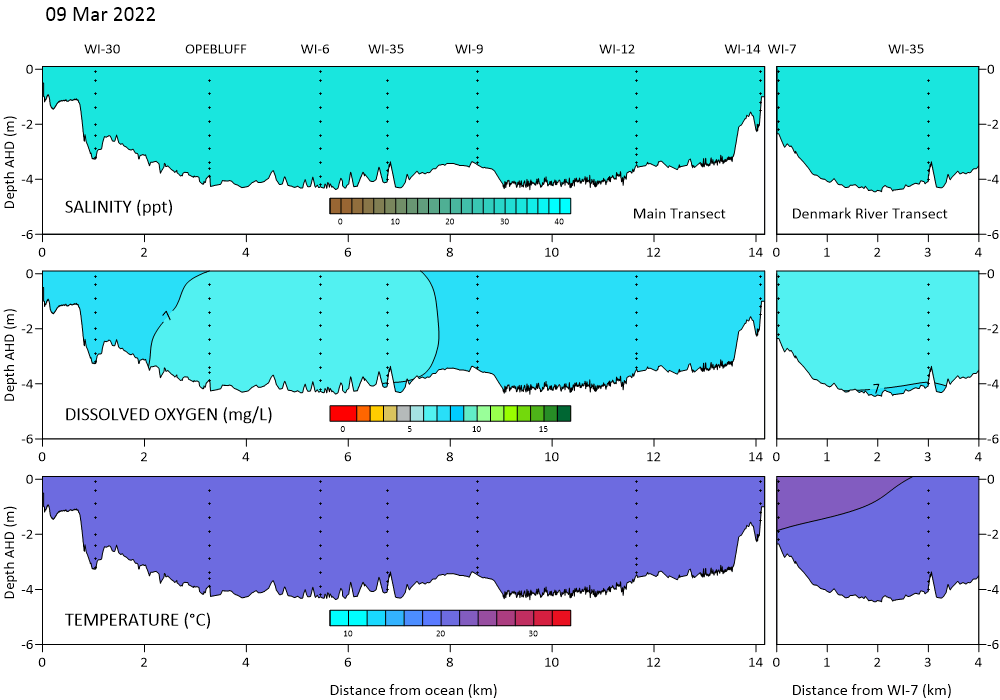
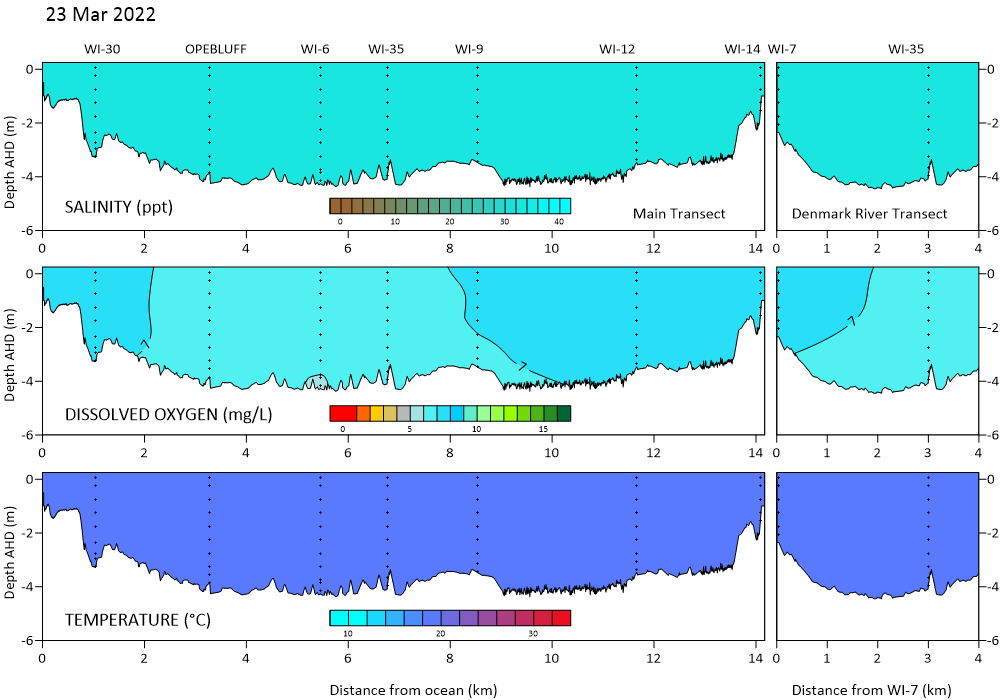
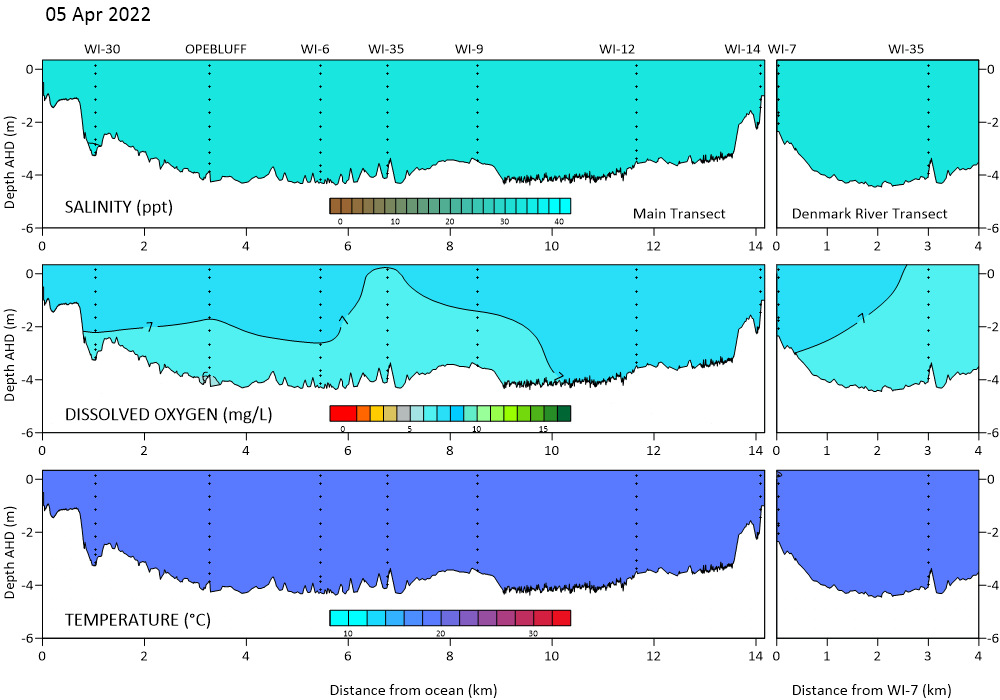
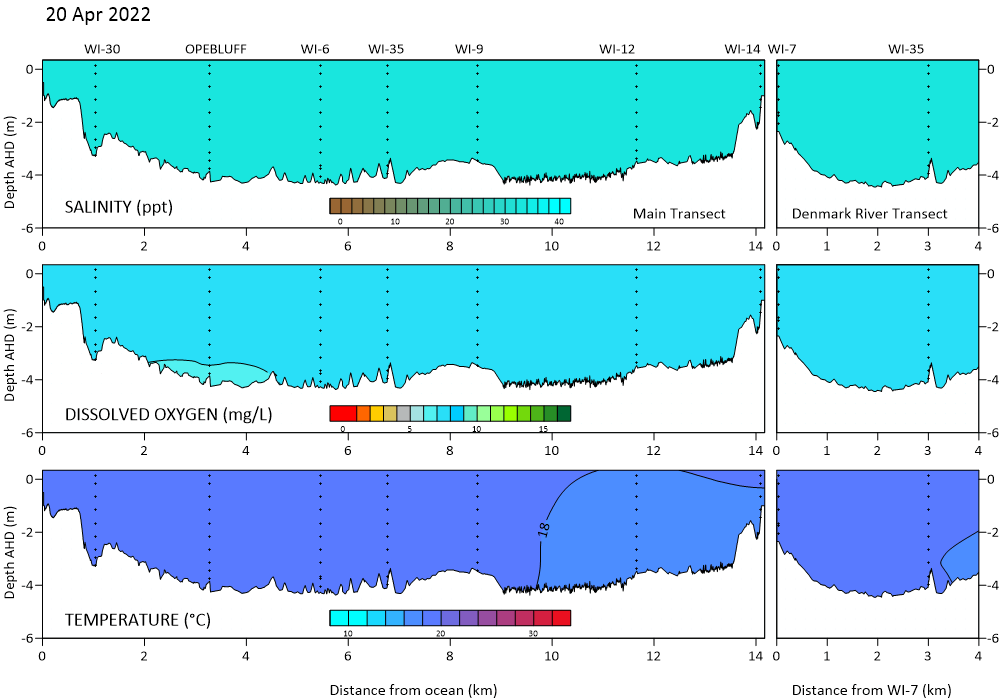
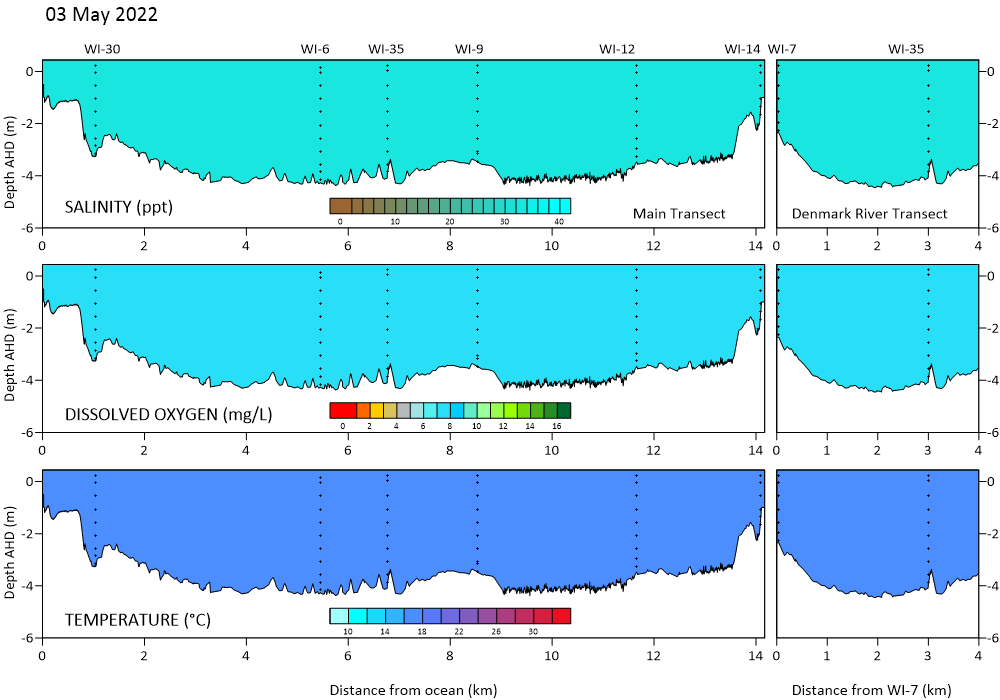
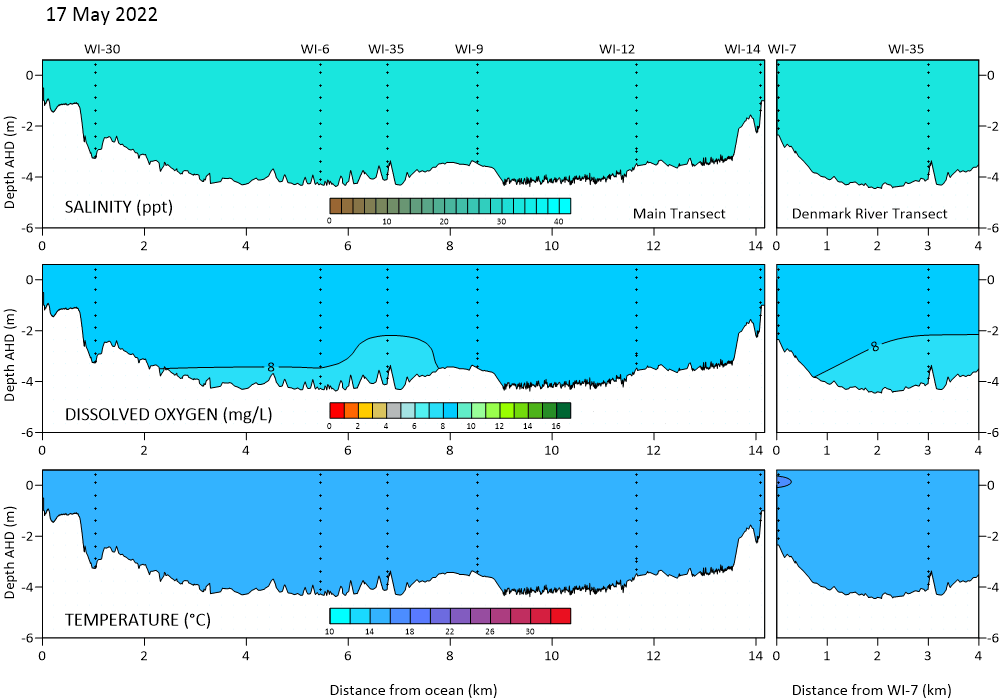
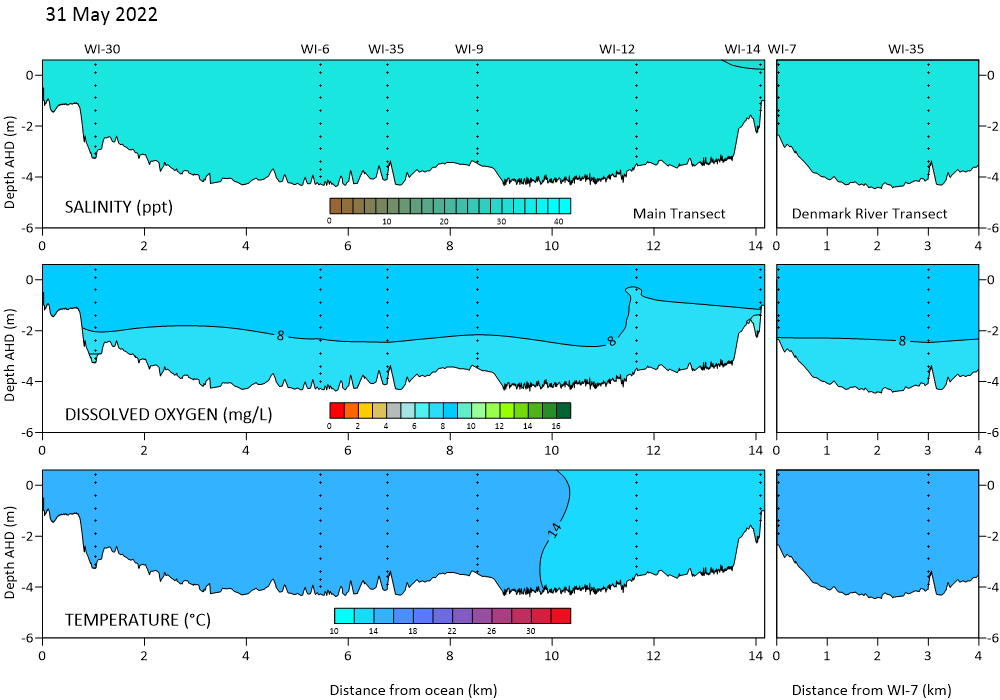
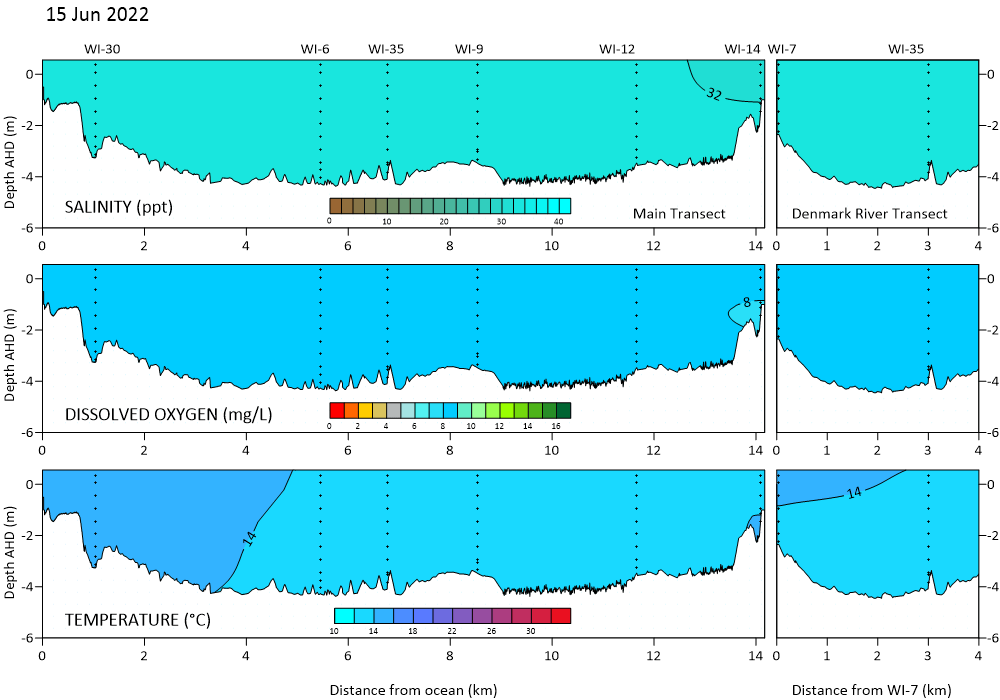
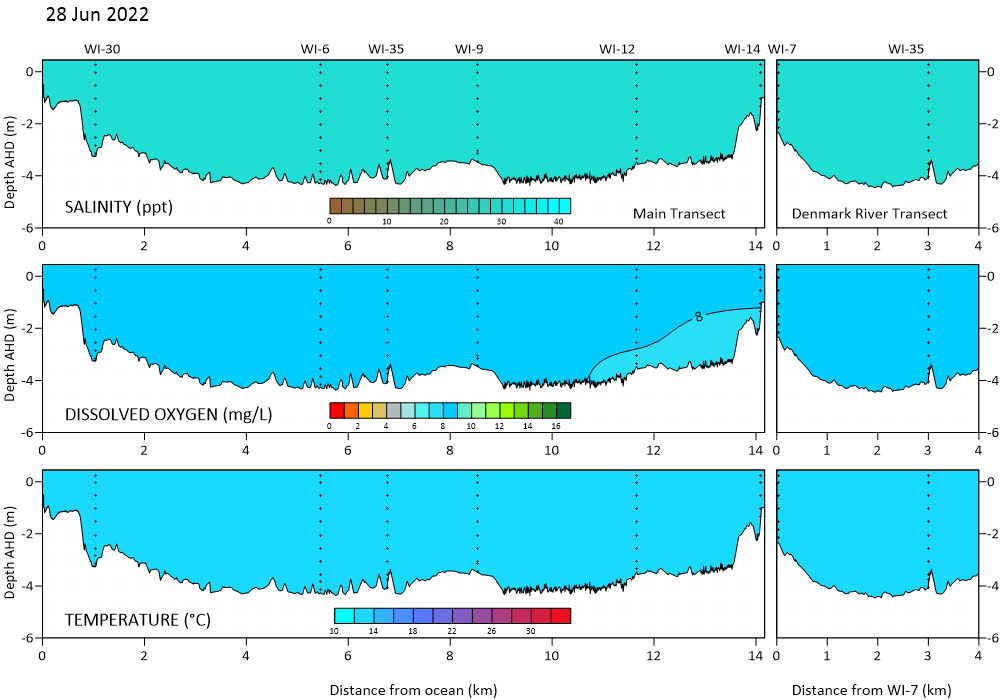
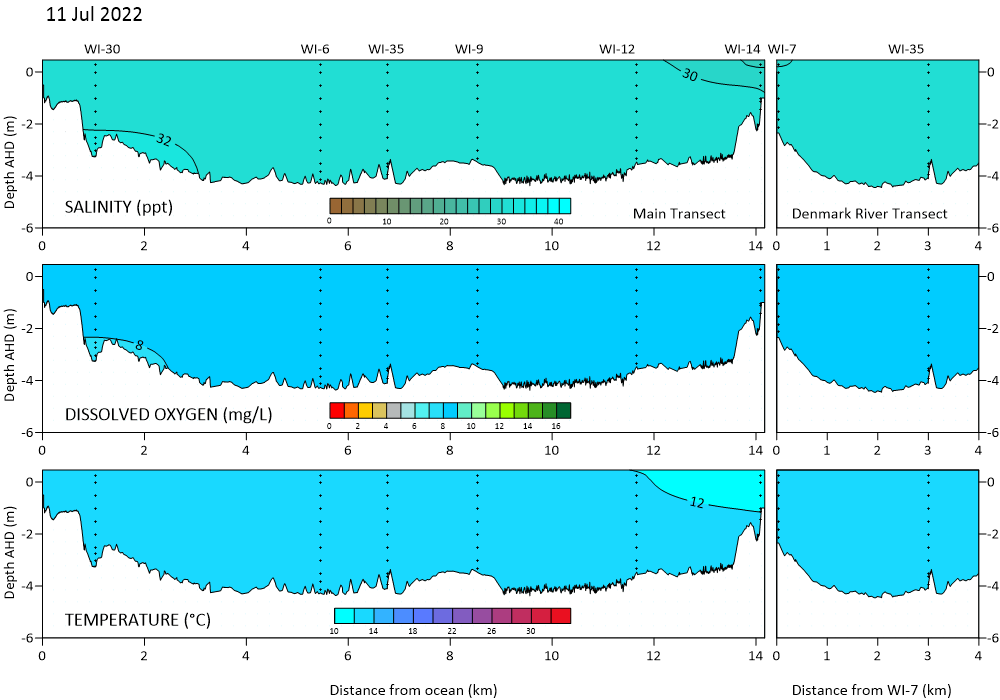
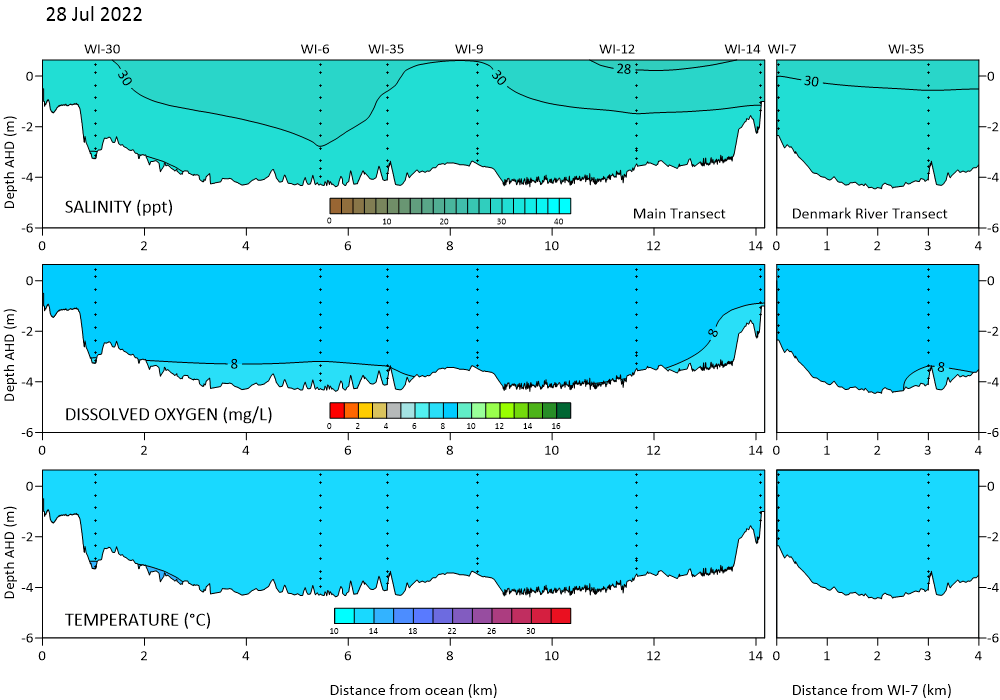
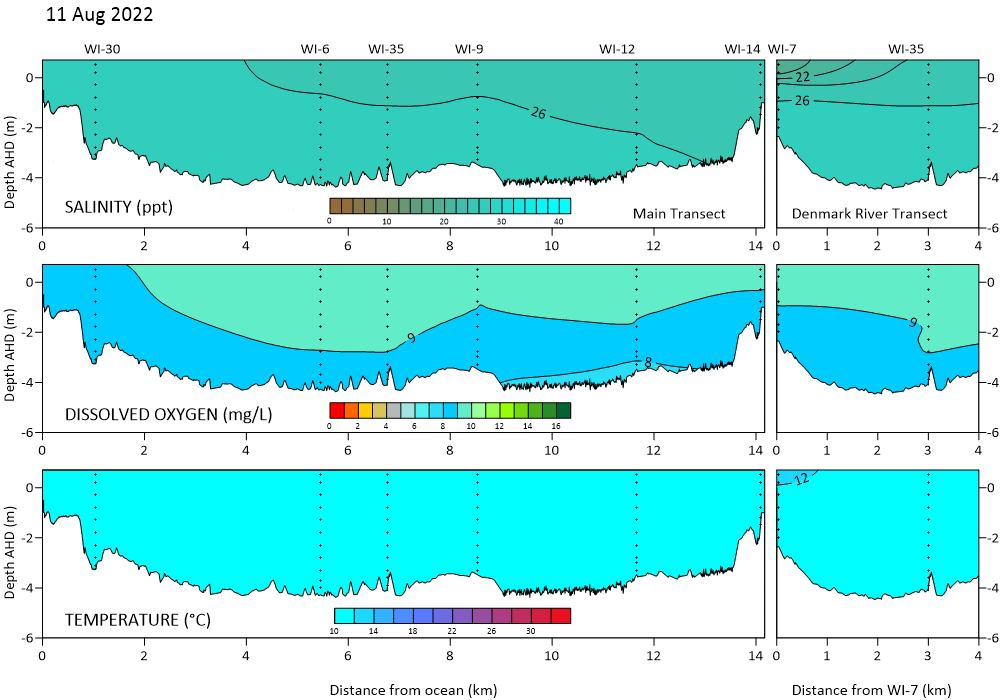
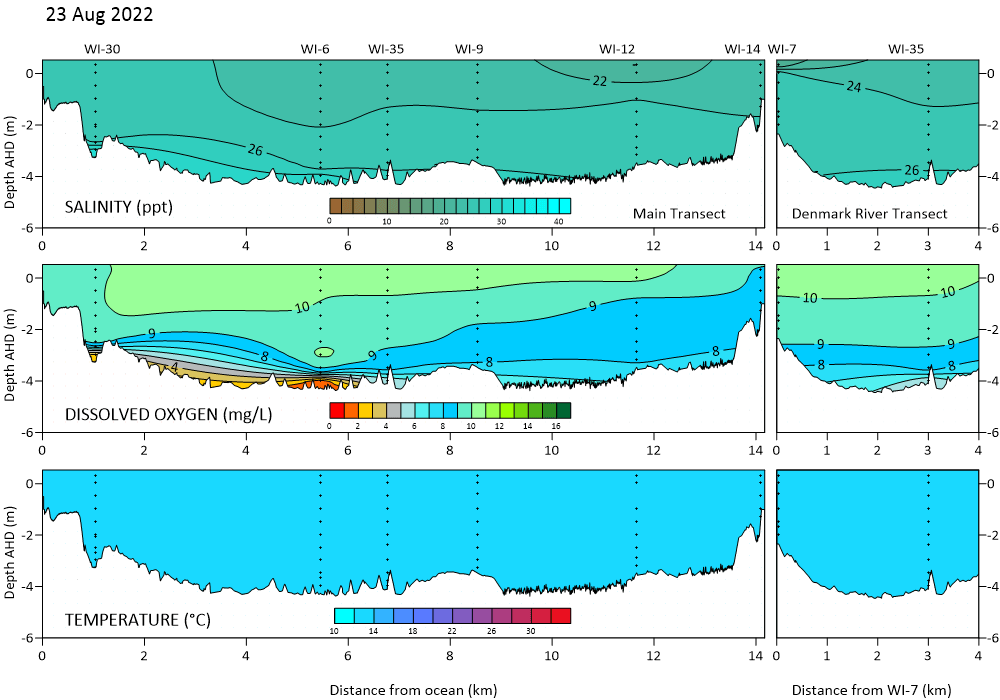
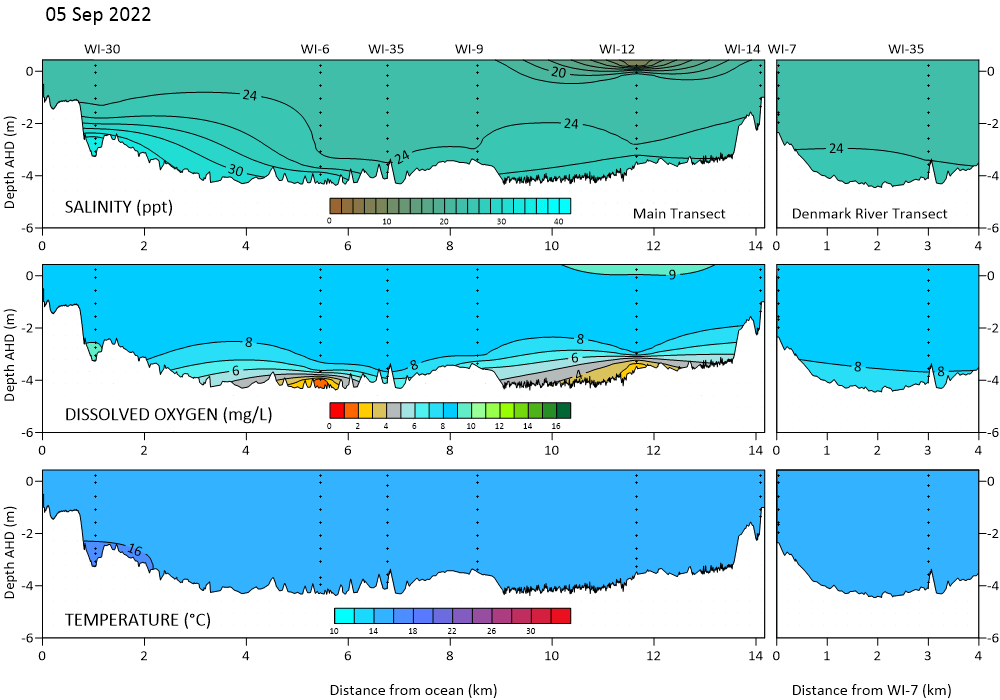
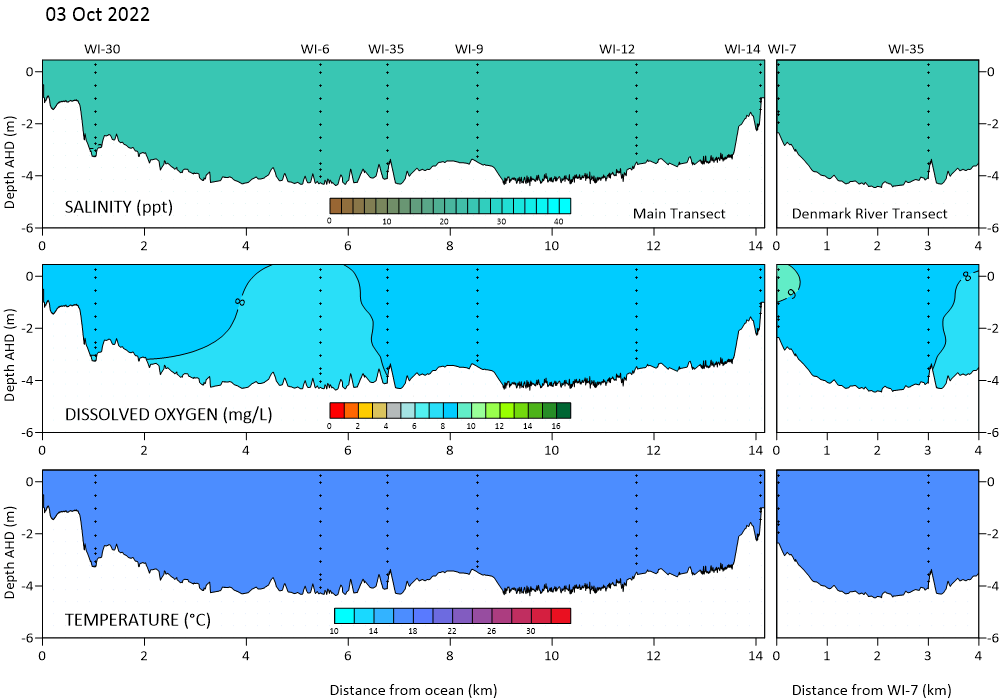
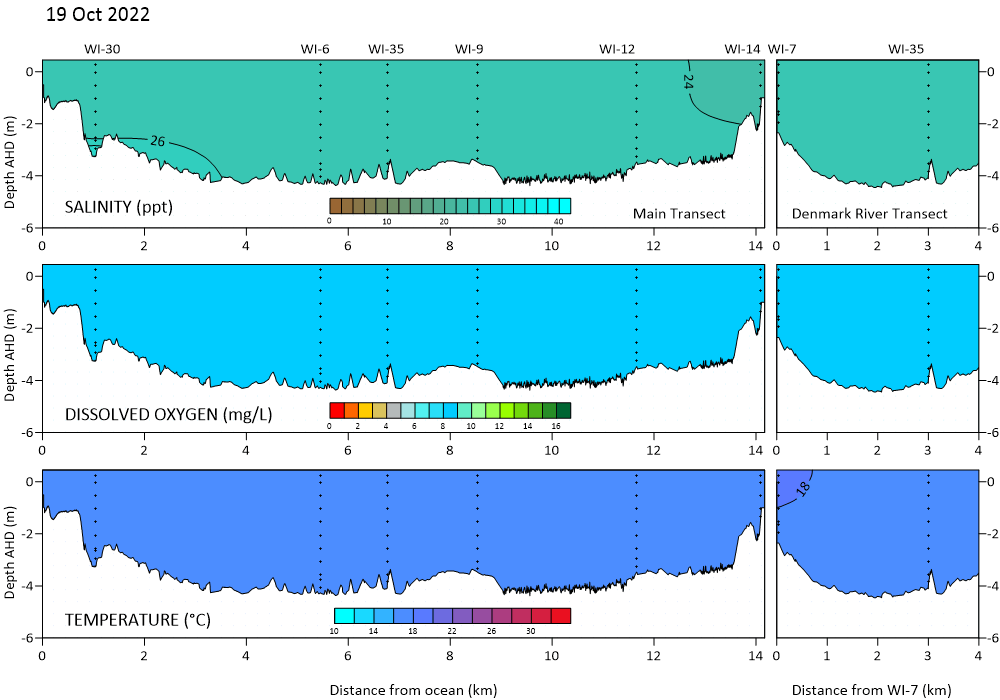
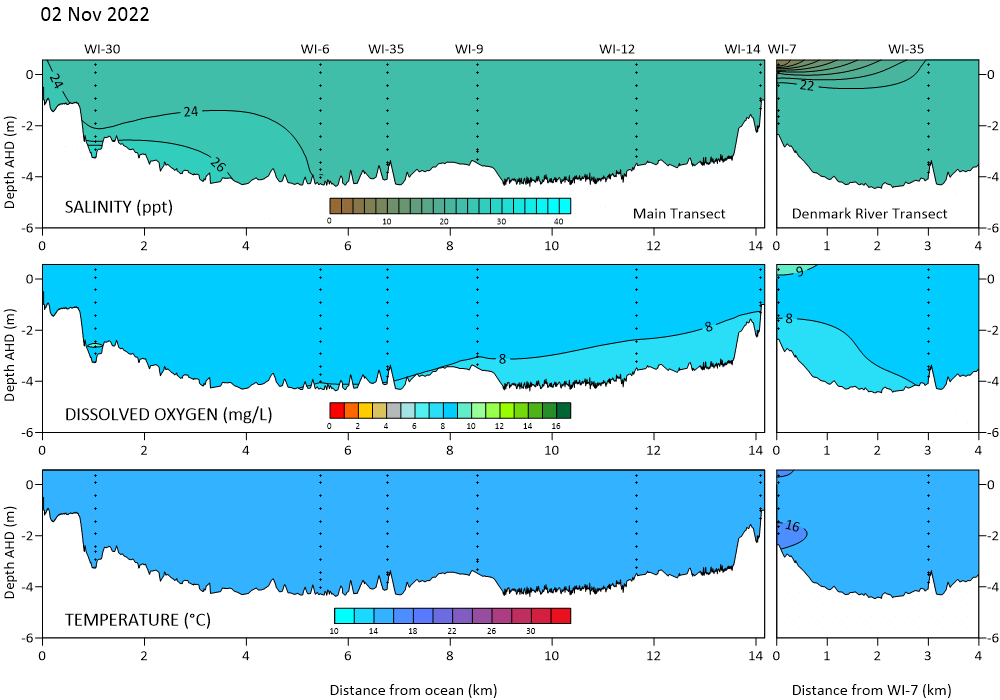
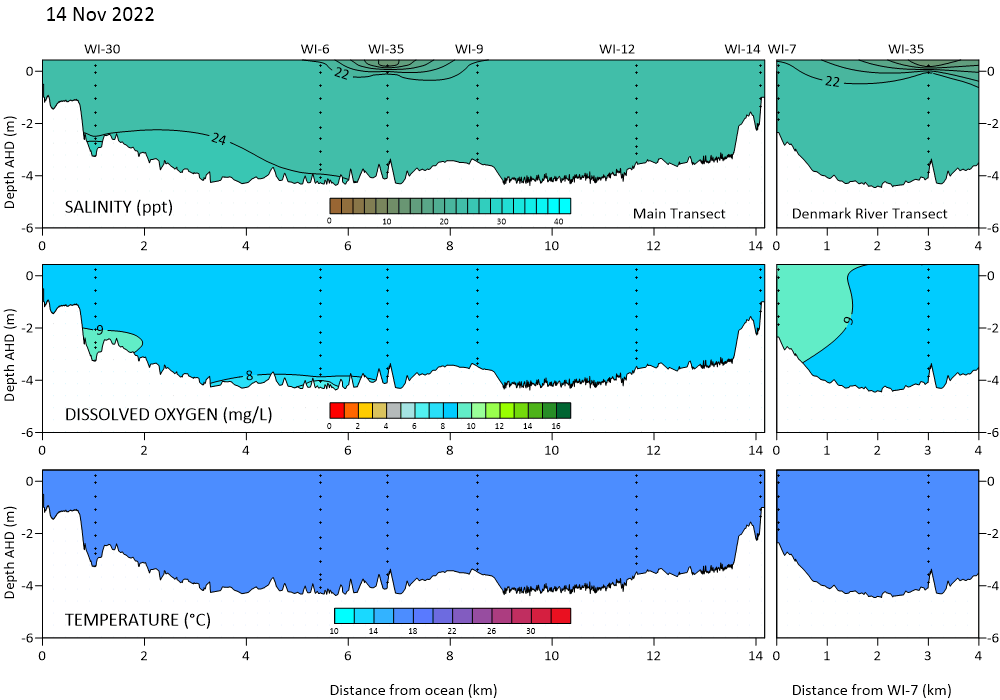
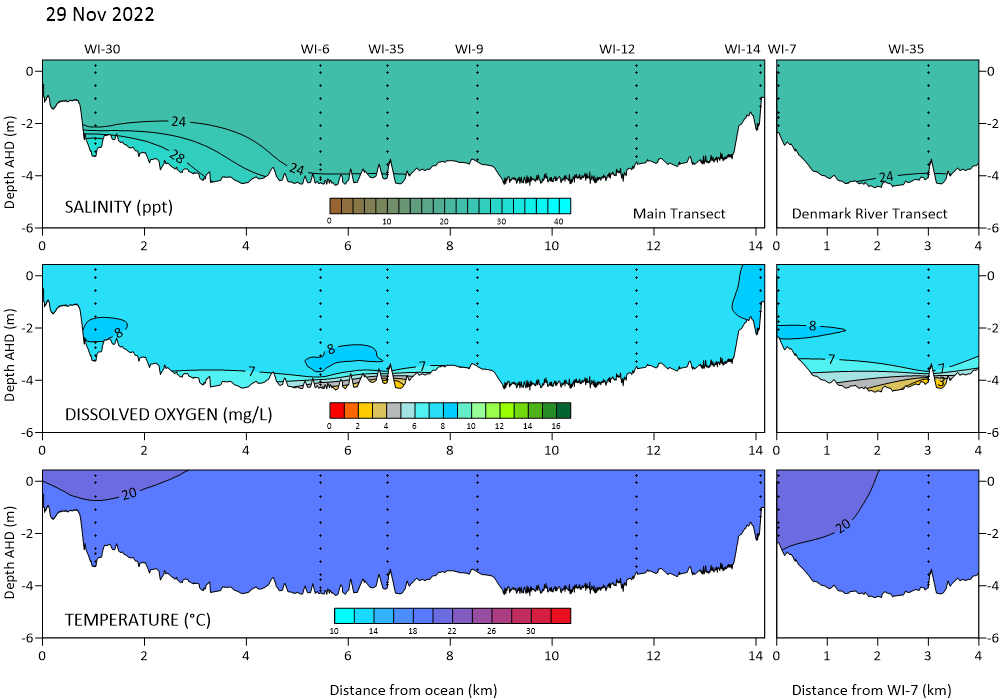
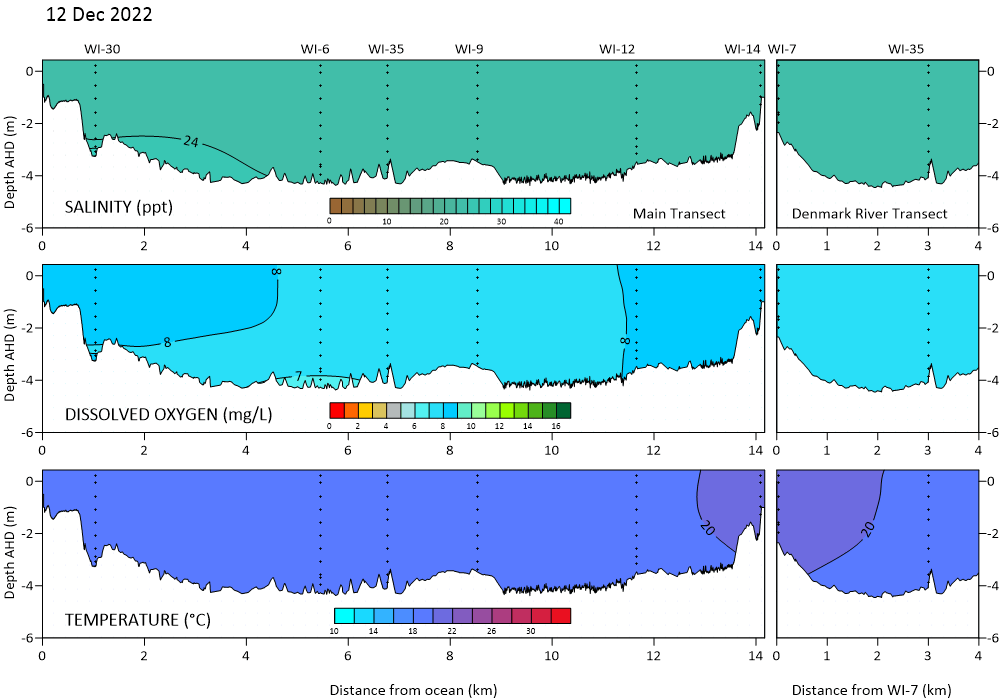
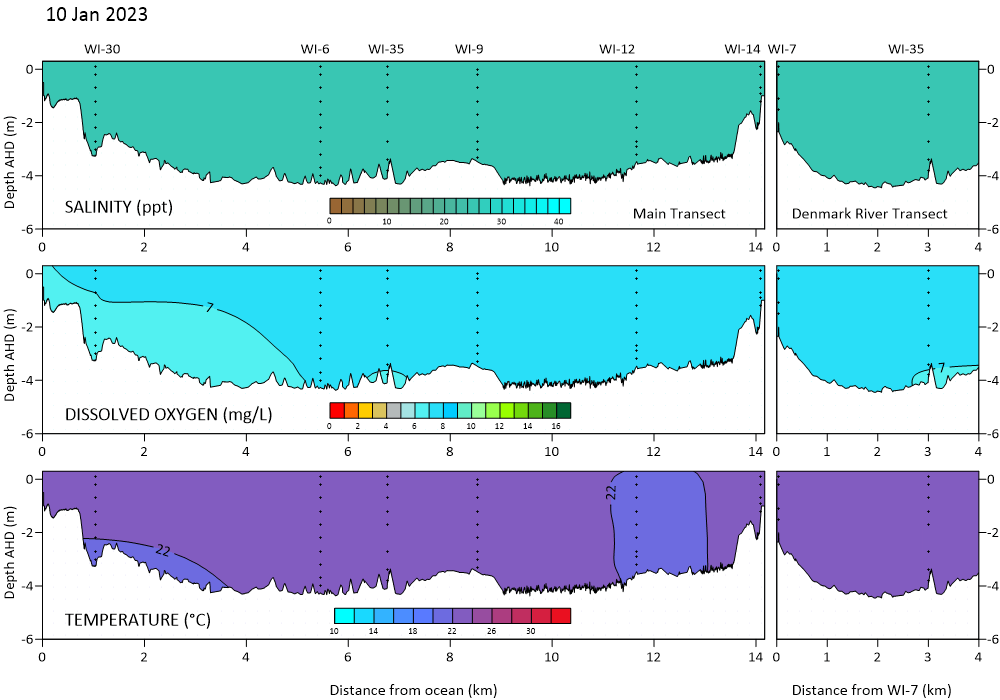
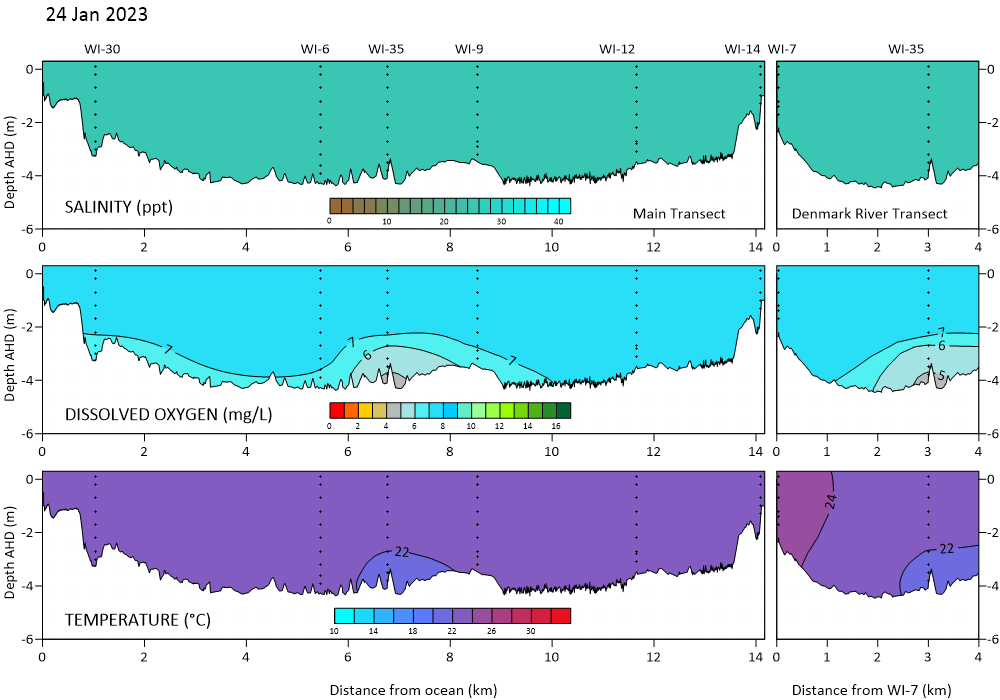
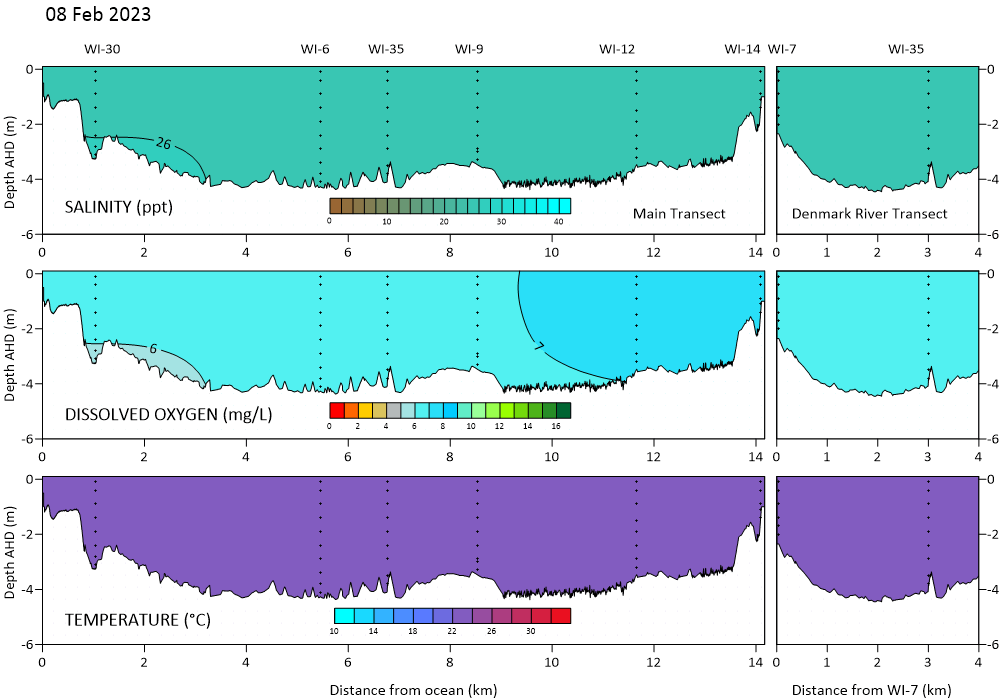
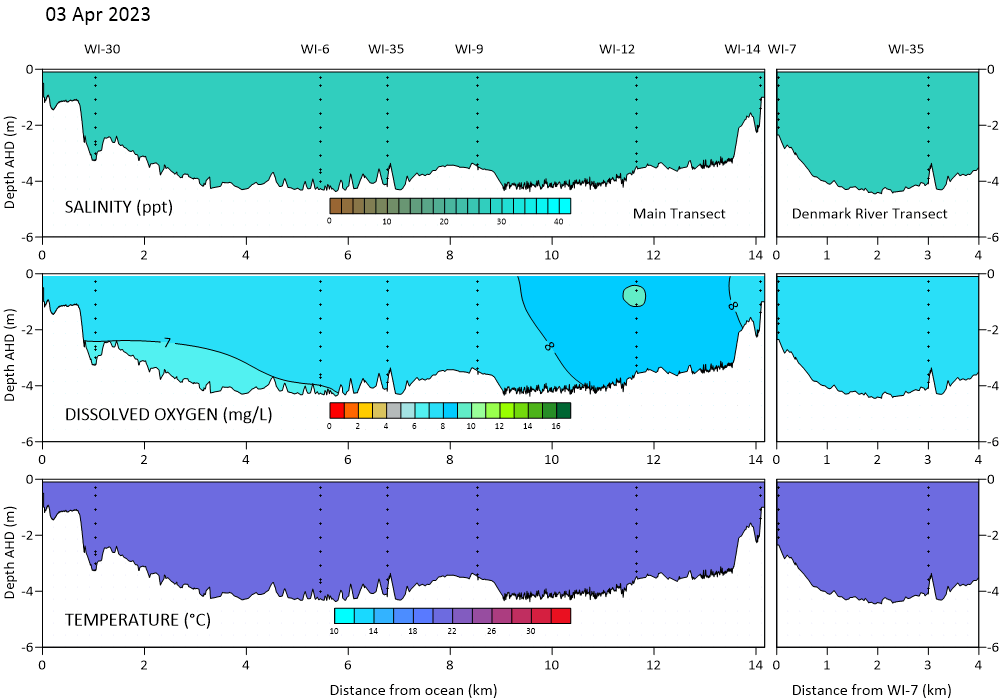
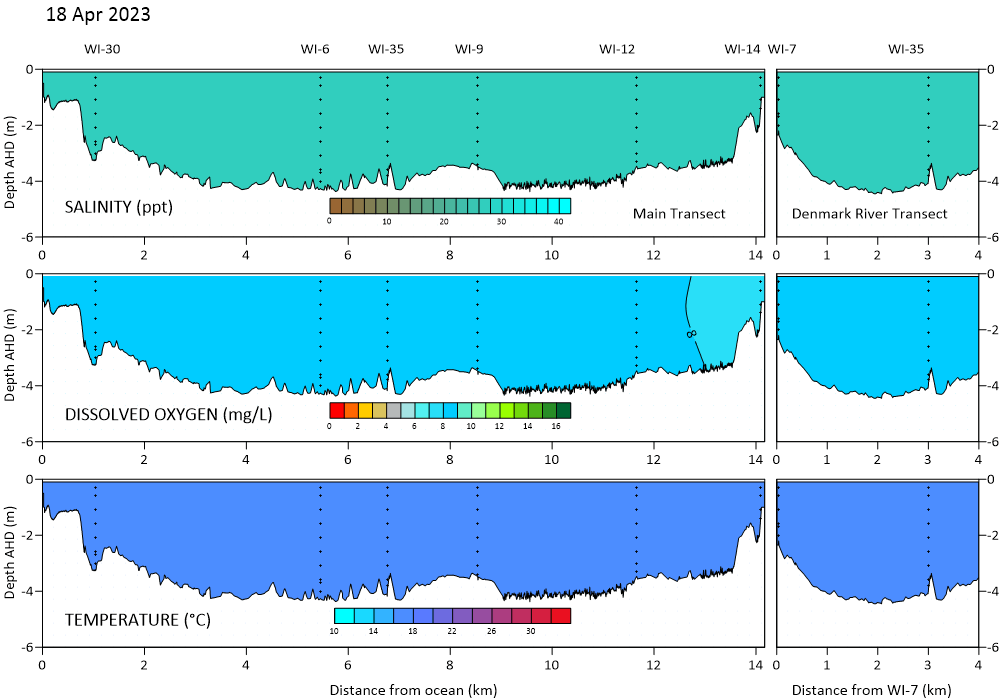
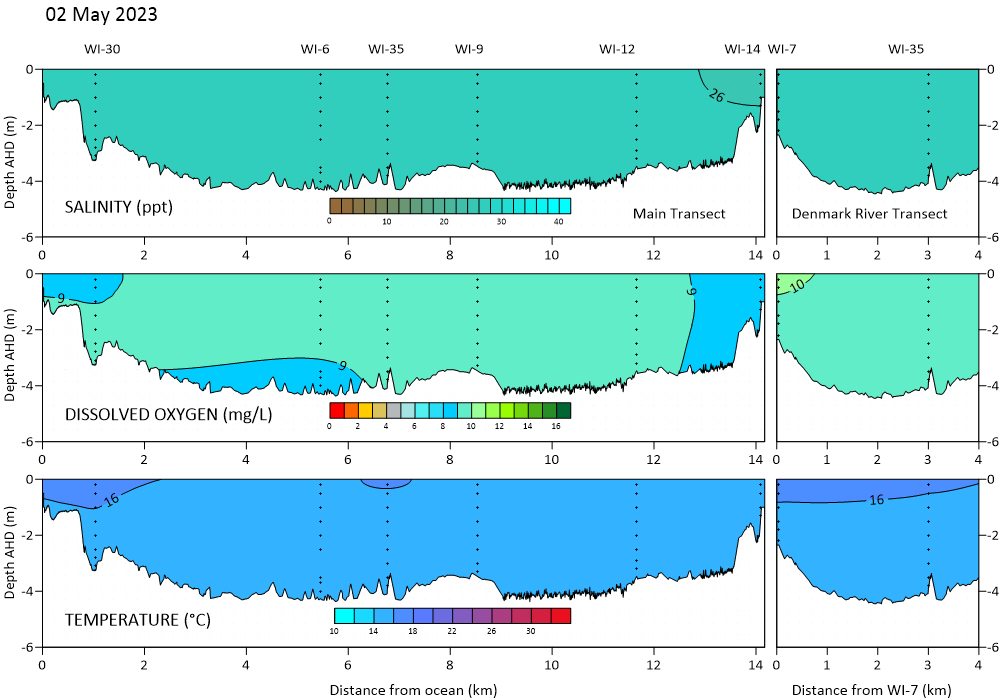
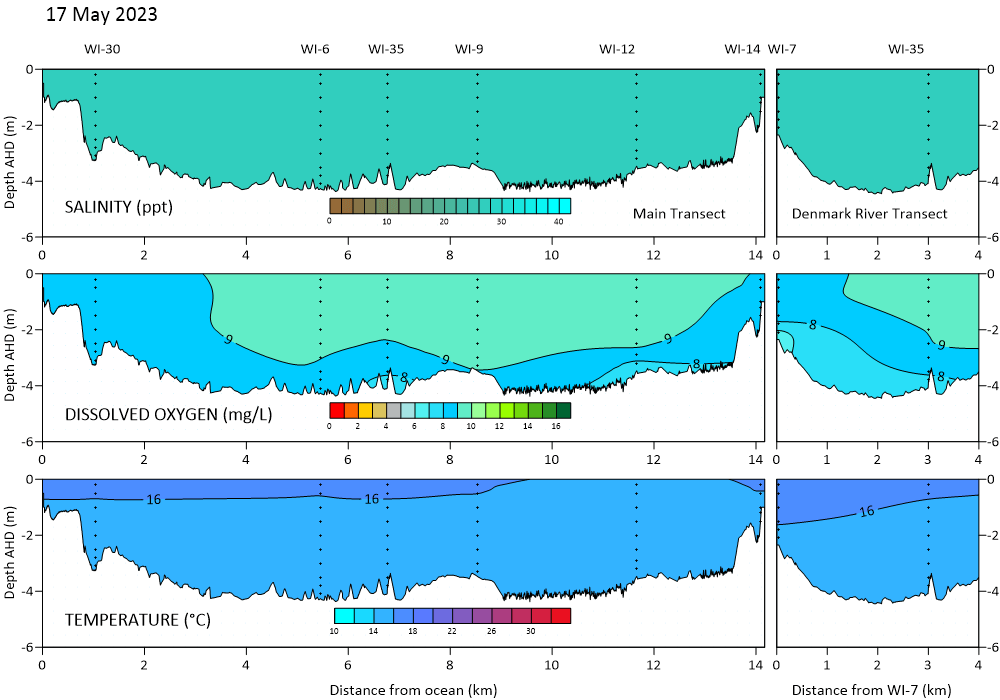
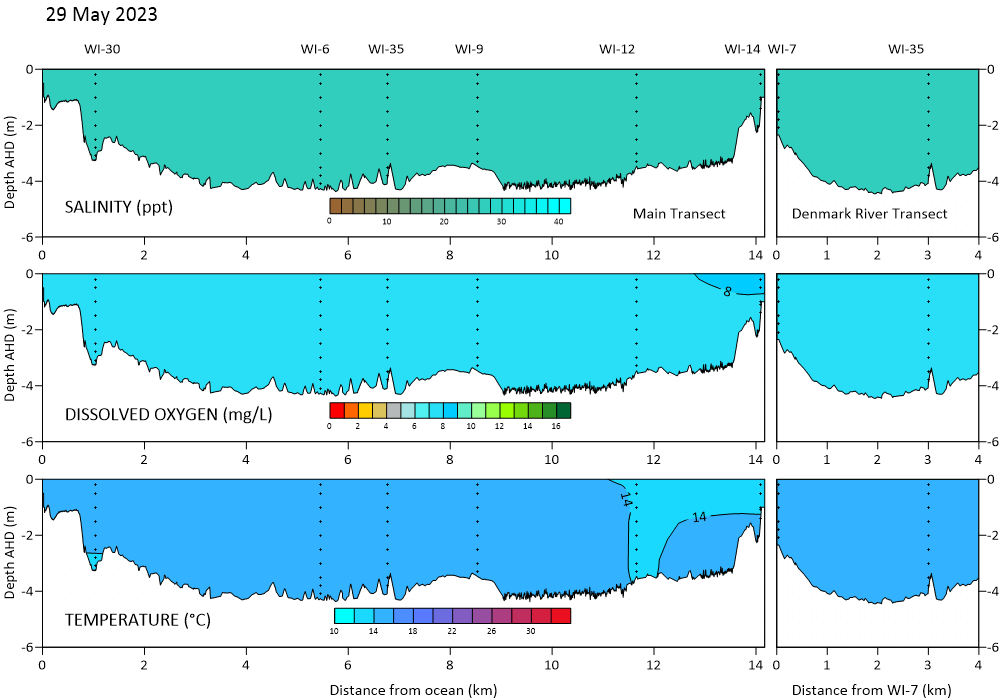
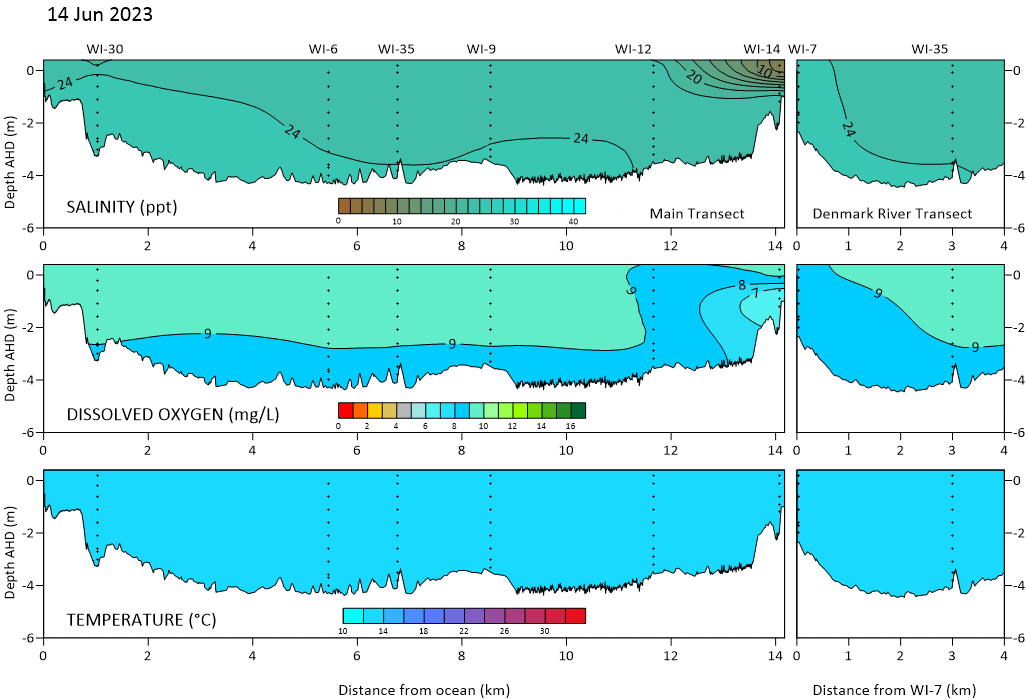
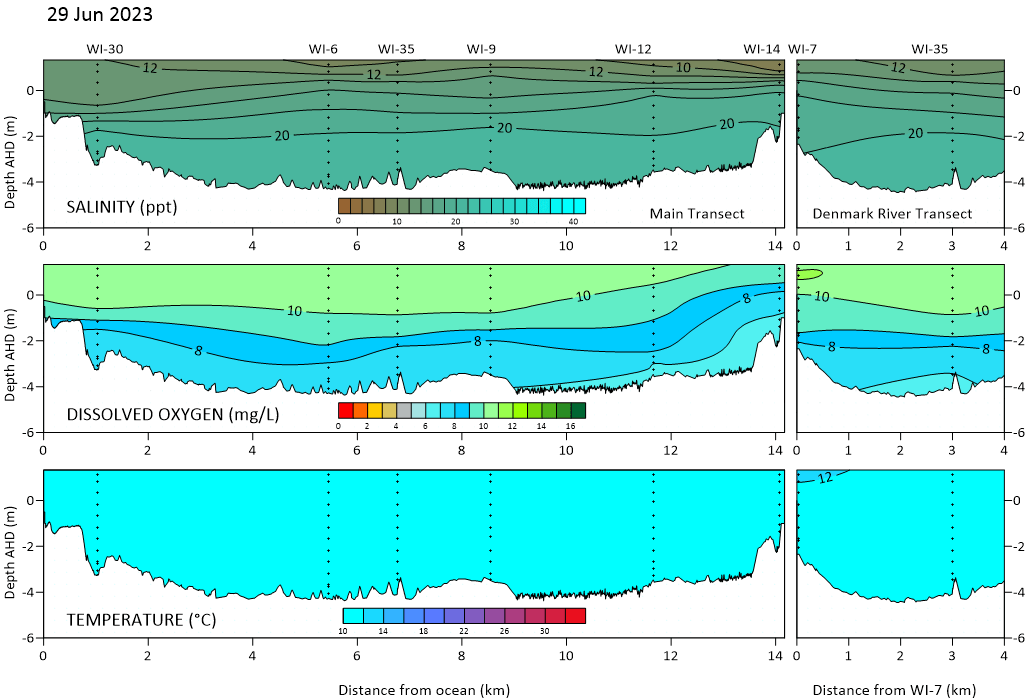
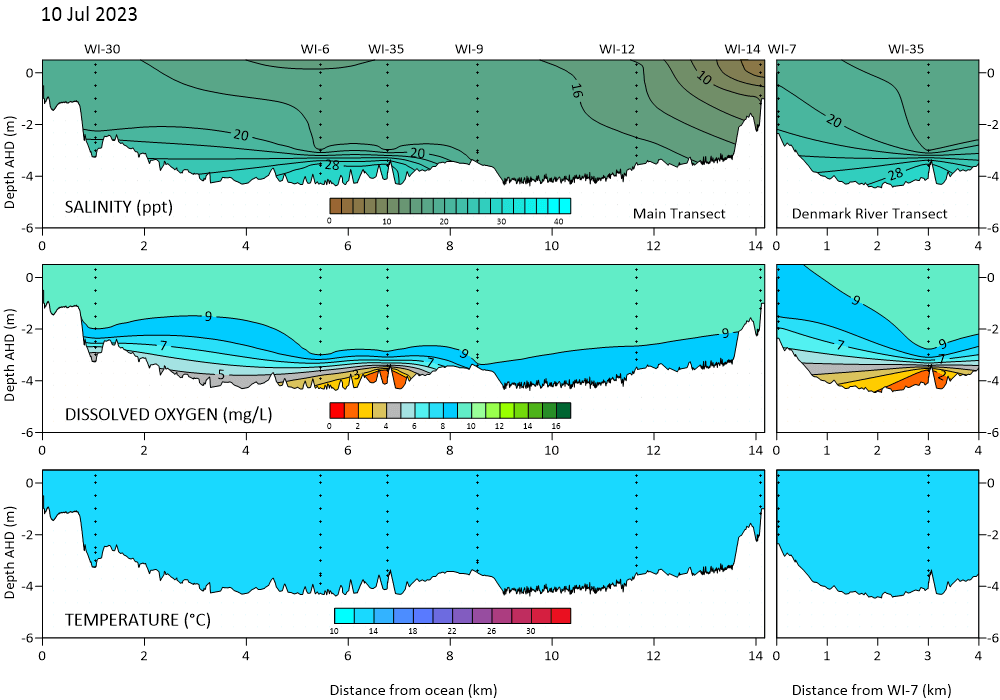
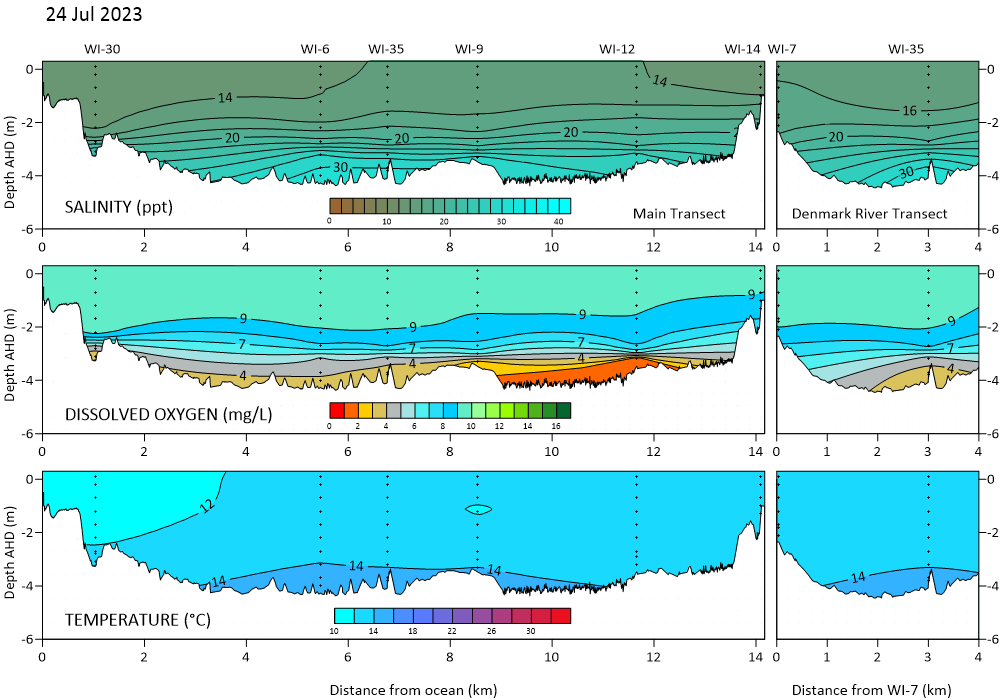
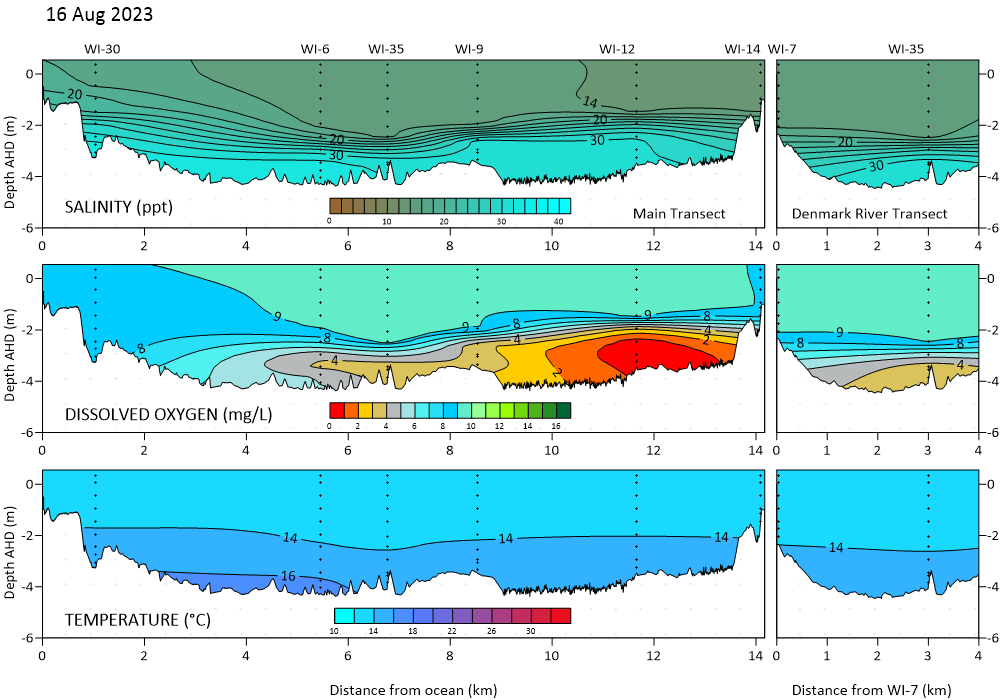
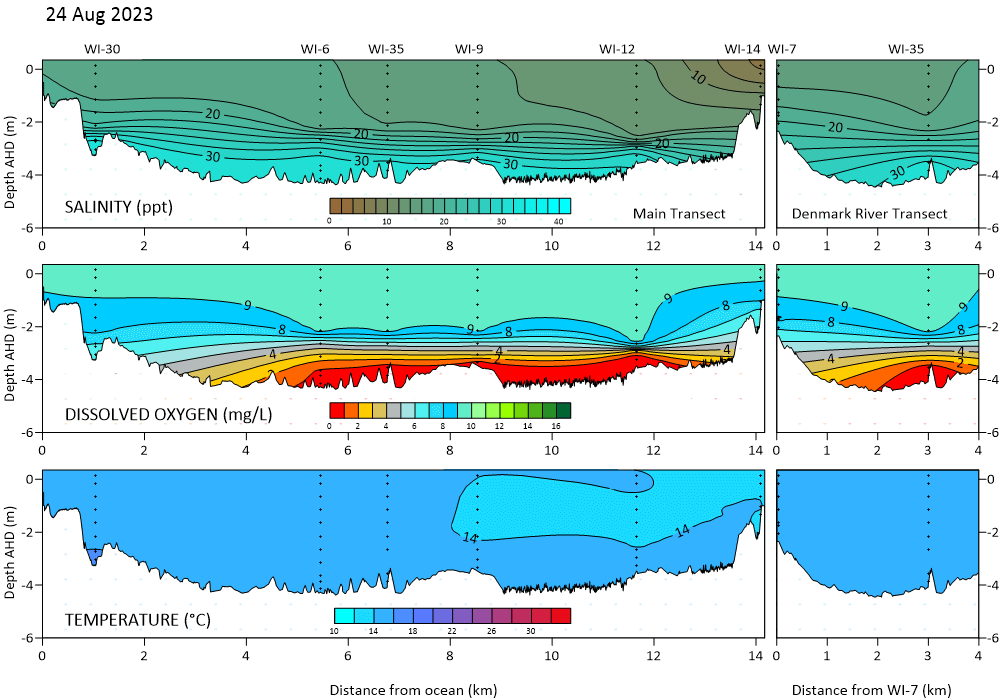
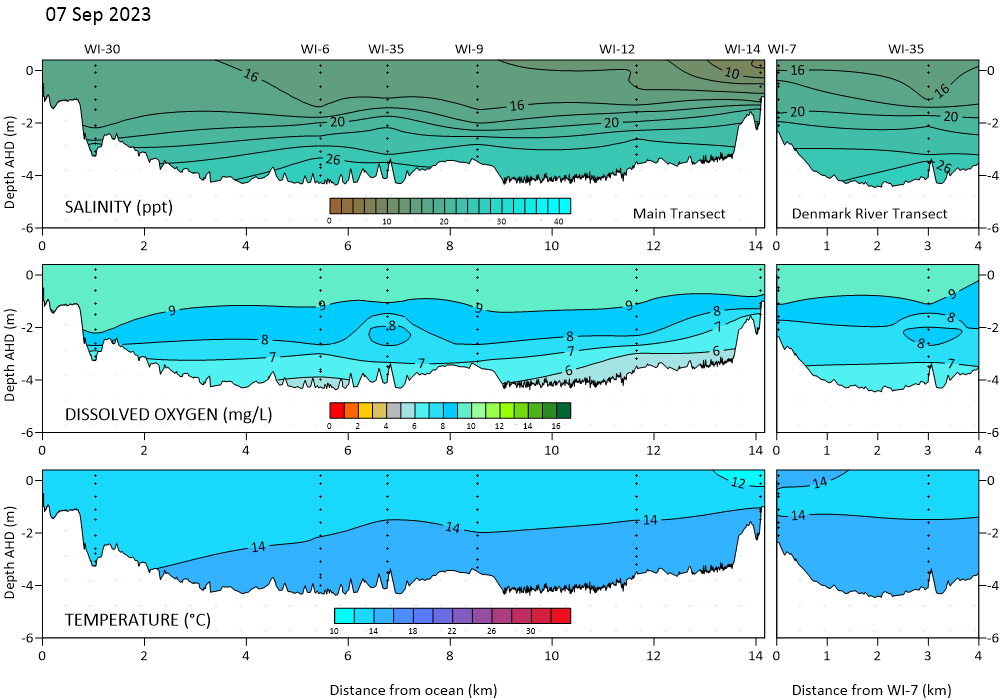
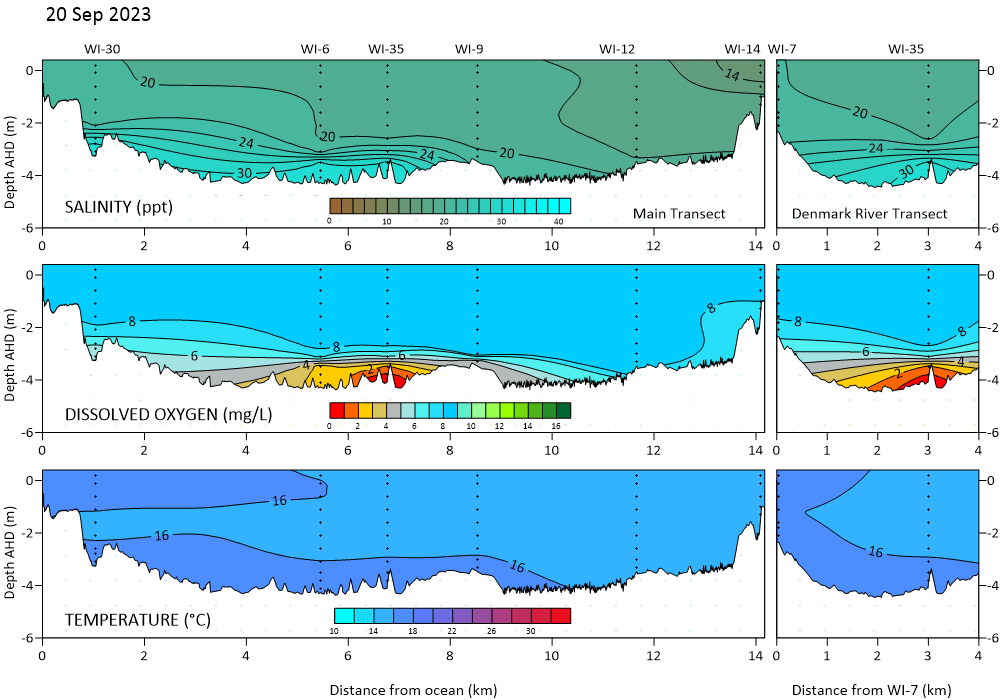
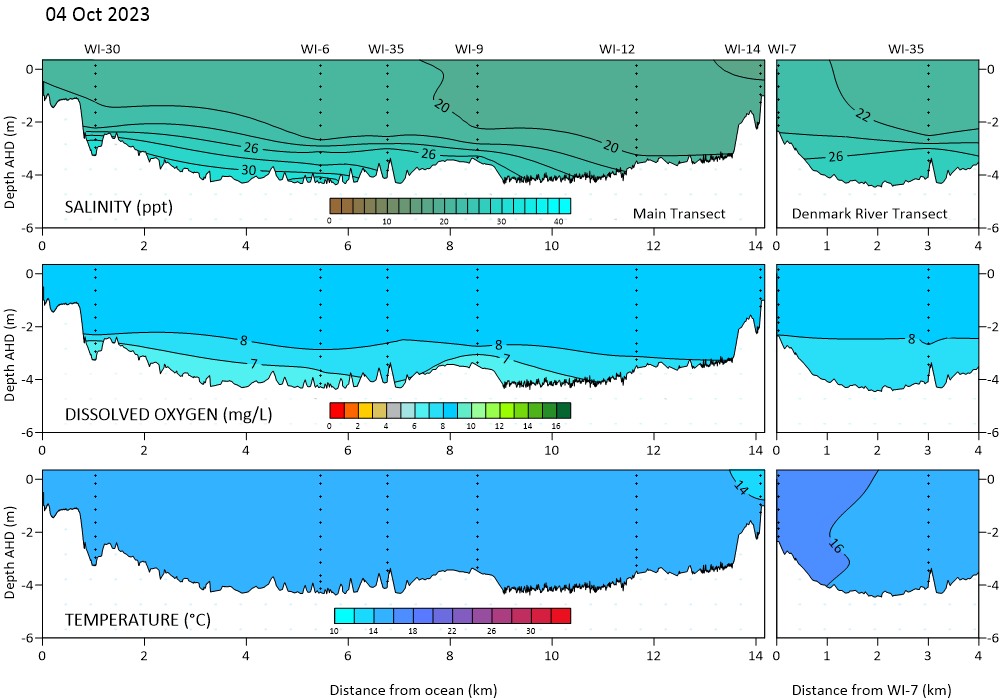
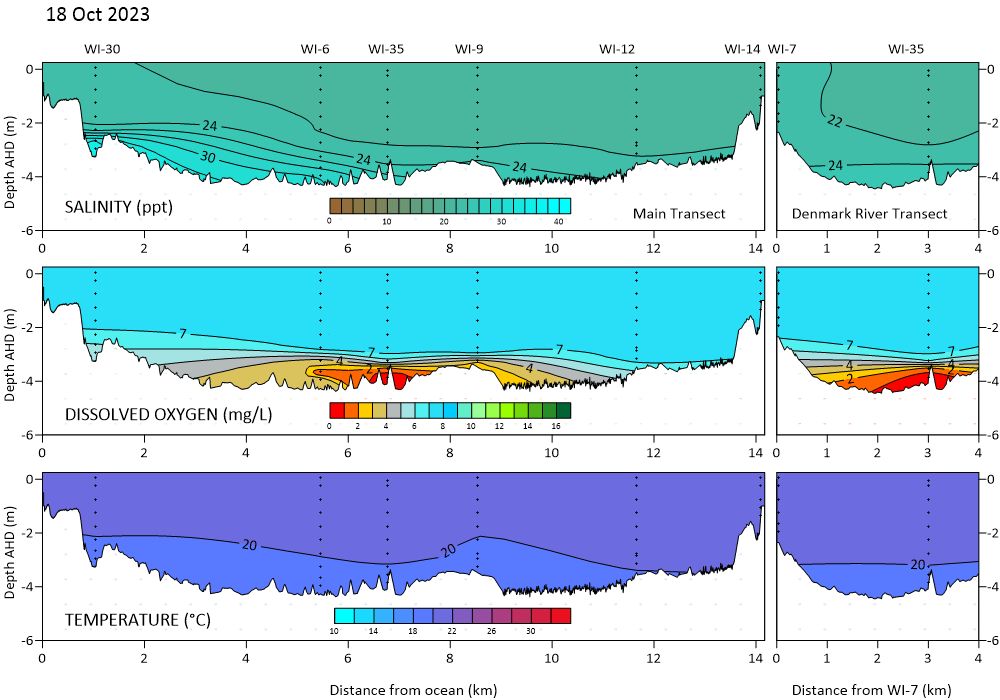
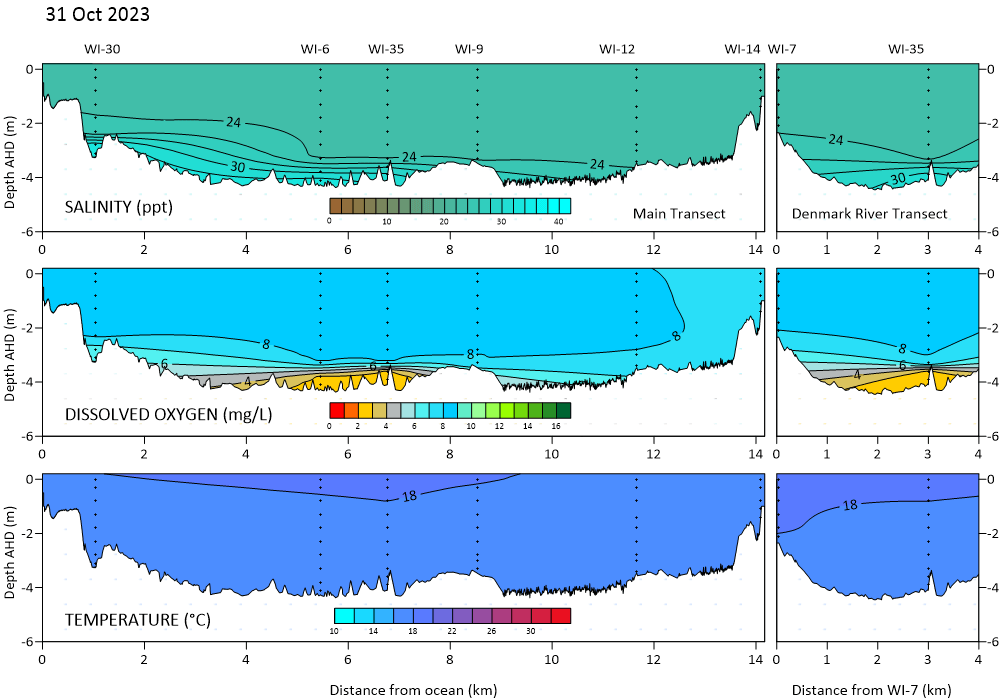
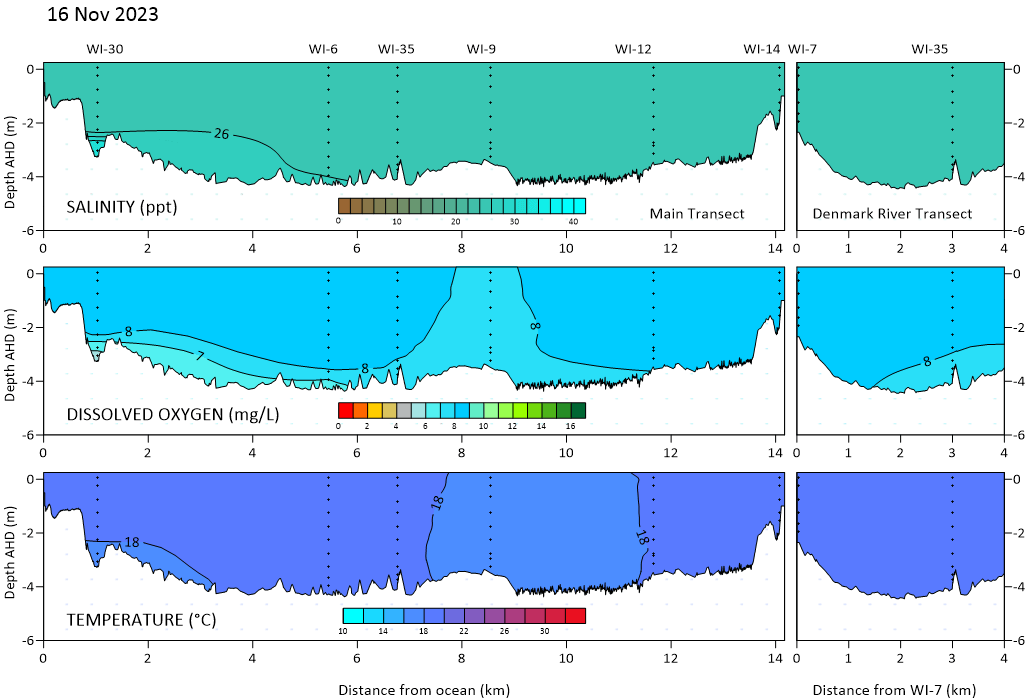
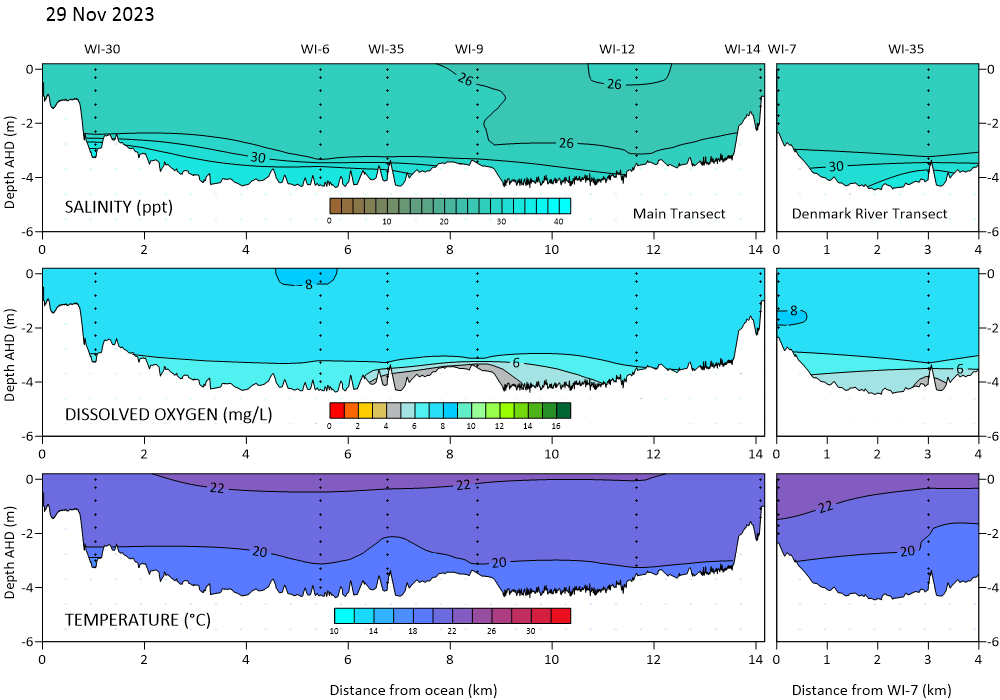
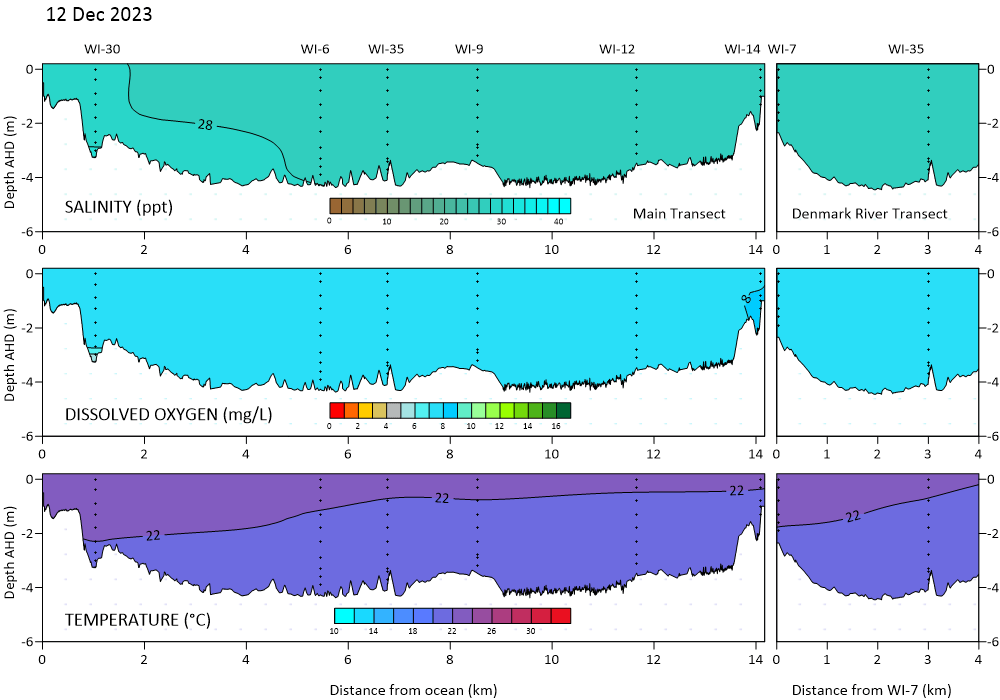
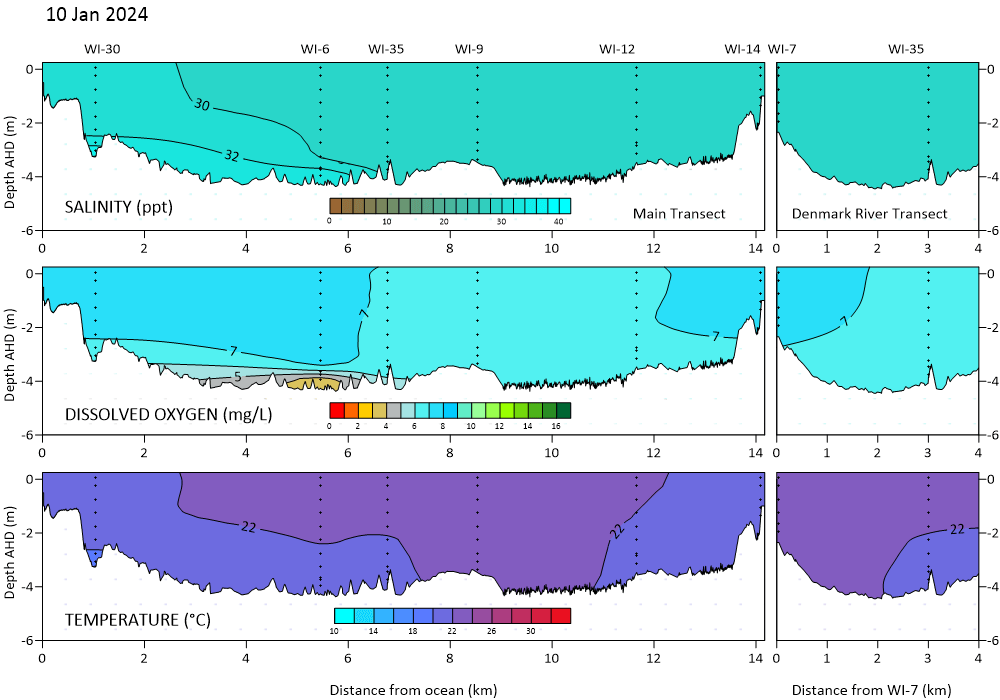
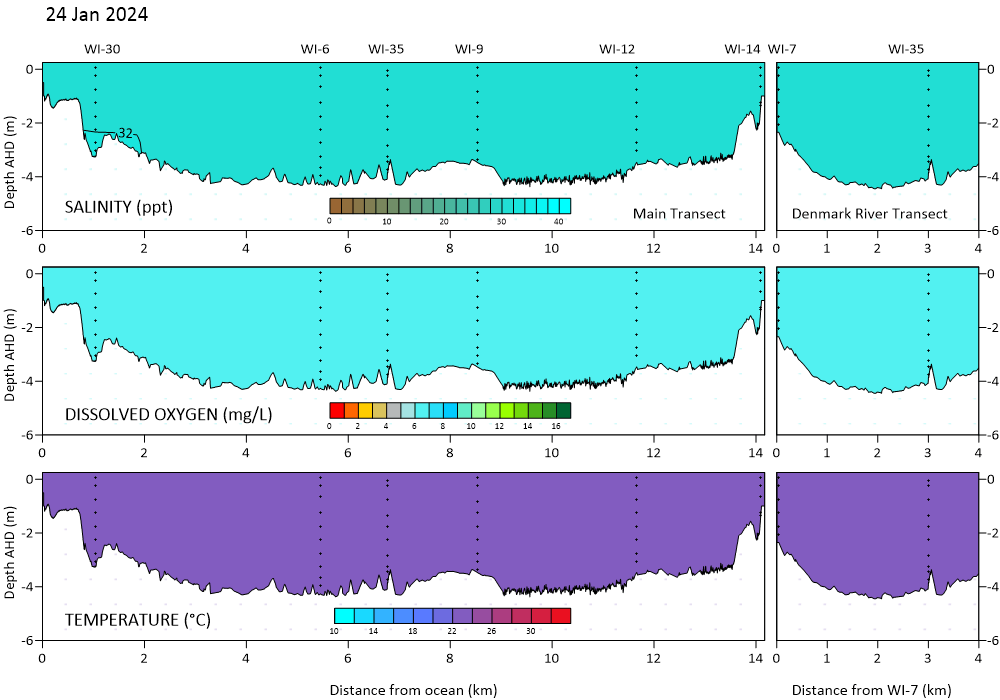
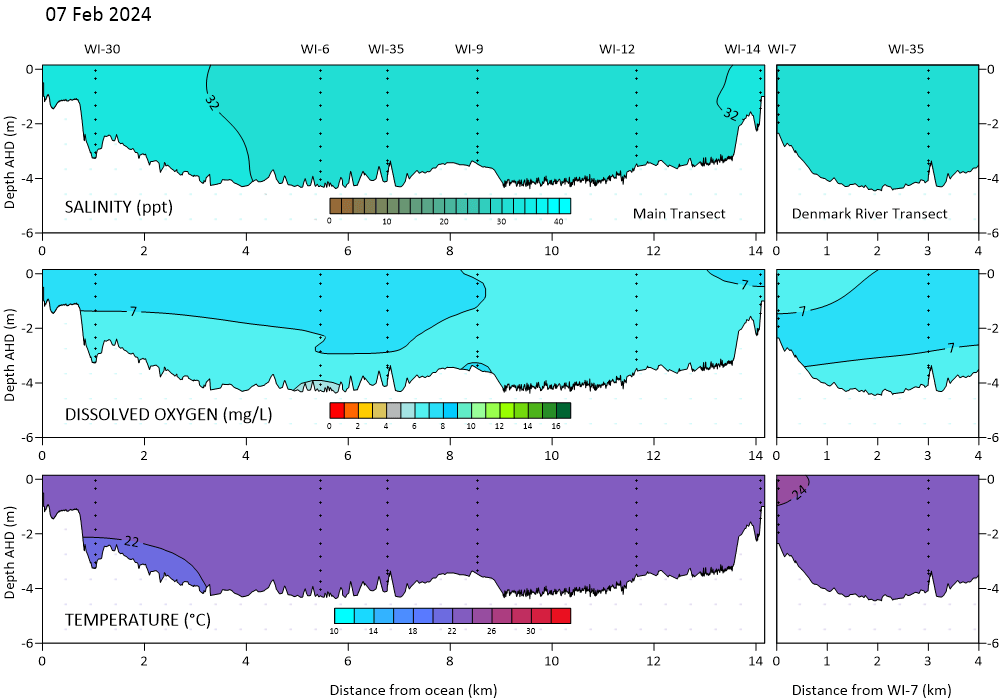
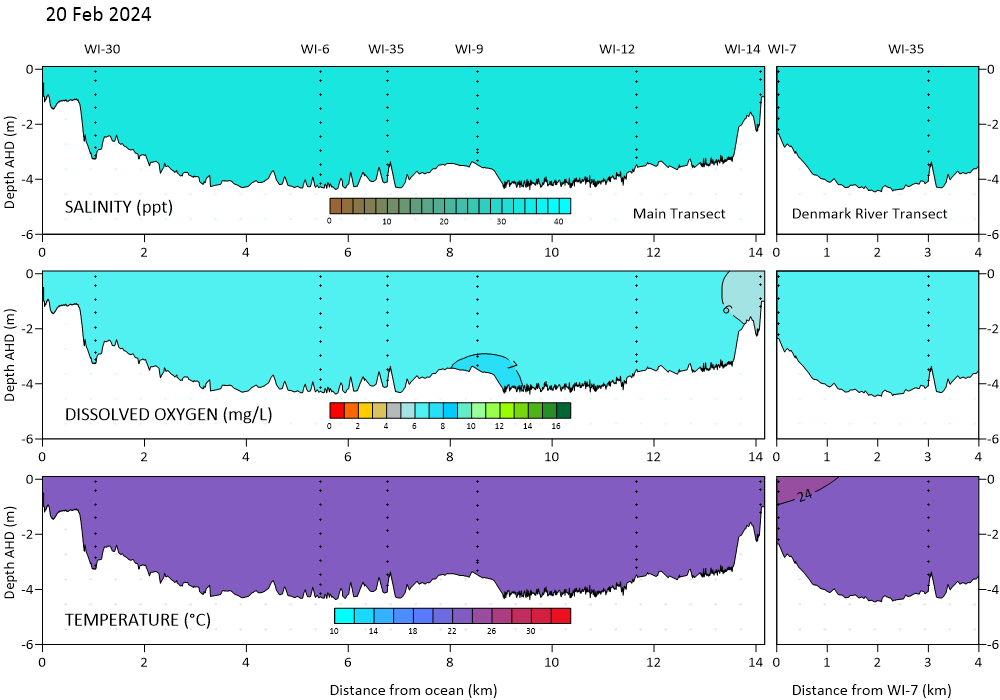
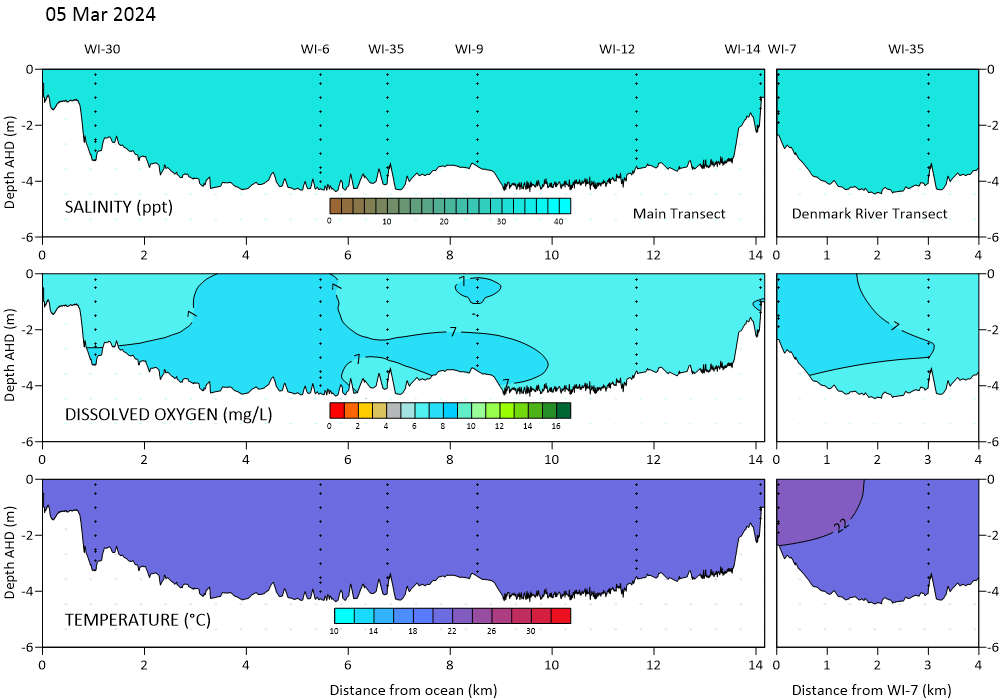
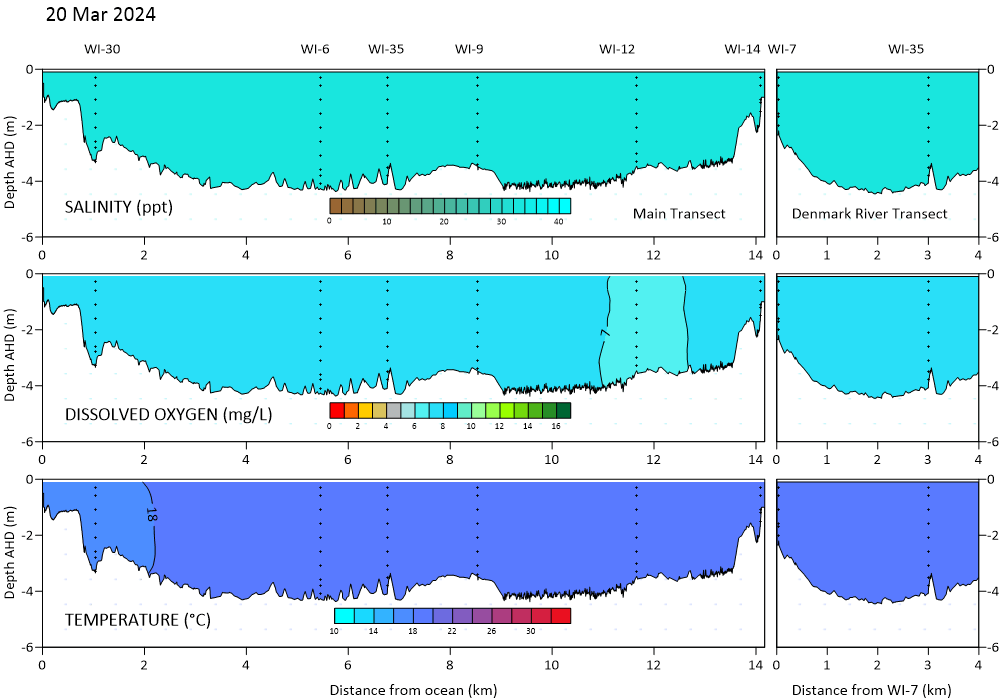
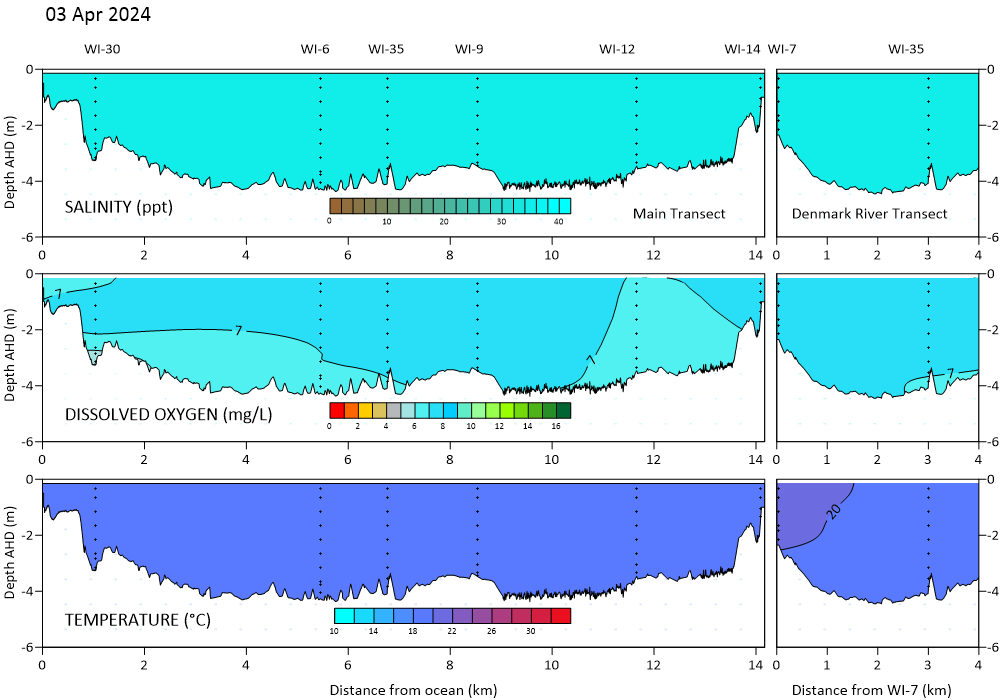
Physical profiles of salinity, oxygen, temperature and depth are monitored fortnightly at 7 sites in the estuary. Physical data is important as the hydrodynamics of water bodies strongly influence the water quality status; the data also support the development and validation of numerical estuarine response models, currently under development. These contour plots show the salinity, oxygen and temperature conditions as a vertical slice through the estuary along the transects . At each site data is measured at about 0.5 m intervals vertically down through the water (dots on the contour plots). Contours are determined by interpolating between data points using SURFER®v13 (Golden Software, LLC). Just like on an elevation map of topography lines on the figure join points of equal concentration (whereas on the elevation map the lines join points of equal elevation).
The contour plot of salinity shows the relative influence of ocean exchange and river flow and whether or not those two inputs are well mixed to give a uniform salinity at a site or form layers of water with different densities (stratified). The denser marine water will tend to sit below fresh water inflows unless there is a source of energy mixing them. Mixing will occur due to wind energy at the surface, and/or from high flow velocities which cause shear and turbulence at the interface of the layers.
The oxygen contour plot shows the amount of oxygen dissolved in the water at the time of sampling. When the waters are well-mixed, shown as uniform salinity, oxygen concentrations tend to be above 6 mg/L and provide healthy conditions for aquatic fauna. When phytoplankton (microscopic algae) bloom, often in the surface layer, oxygen concentrations may exceed 10 mg/L. This is plenty of oxygen for fish but potentially harmful as high densities of algal cells can block their gills.
When the water is stratified, shown by horizontal contours lines of salinity, the oxygen in the bottom layer is rapidly consumed by organic breakdown leading to anoxic or hypoxic conditions. Oxygen concentrations below 4.8 mg/L are stressful to fish and below 2 mg/L can be lethal.
Low oxygen conditions in bottom waters also negatively impact water quality by enabling release of sediment-bound nutrients. This in turn, can lead to excessive algal growth.
Temperature contours show the temperature status throughout the water column. Temperature varies temporally in response to the daily and seasonal solar radiation patterns, and spatially due to different water sources – marine or freshwater inflows and depth.