Monitoring data
Near Ocean = WI-30
Central = deep basin sites (WI-6, WI-35, WI-9, WI-12)
Riverine = (WI-7, WI-14)
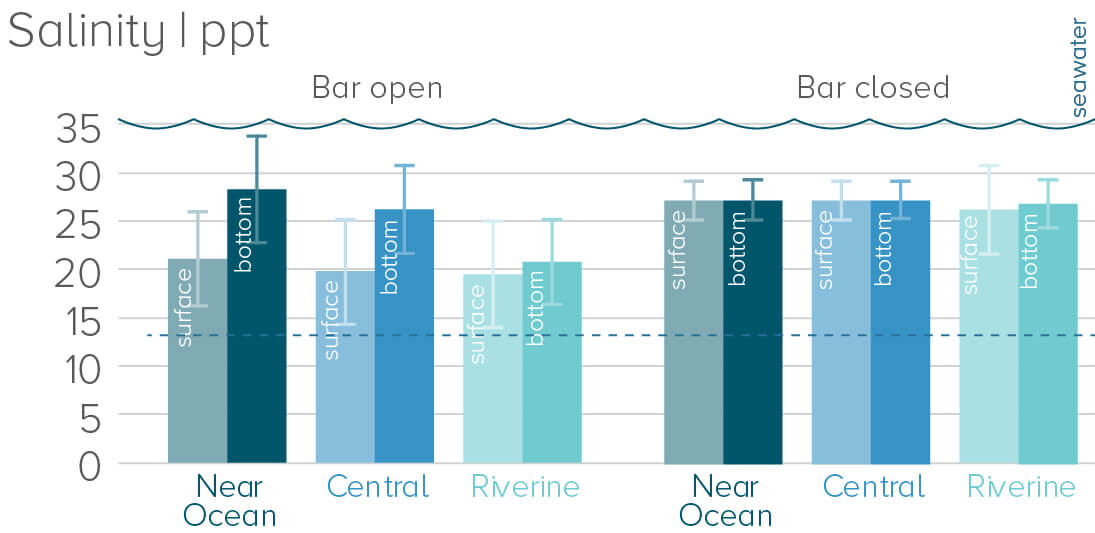
Salinity
There is a large variability in the salinity of Wilson Inlet depending on rain flowing in from the catchment and whether the bar is open or closed. When the bar was open, the salinity of Wilson Inlet varied between the surface and the bottom of the estuary, caused by the heavier marine water entering the estuary and creating a layer below the less dense brackish water (stratification). When the bar was closed, without water exchange with the ocean and with strong prevailing winds, the waters were well mixed and salinities were consistently around 27 ppt.
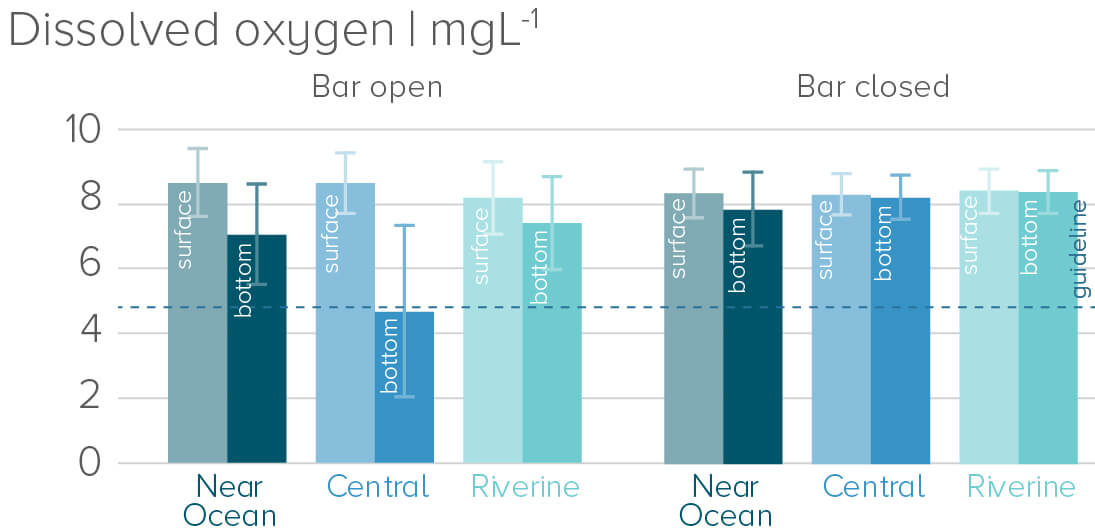
Dissolved oxygen
Dissolved oxygen is the amount of oxygen dissolved in the water through absorption from the atmosphere and/or as a result of photosynthesis by seagrass or algae.
When the bar was open, most zones had healthy dissolved oxygen levels, the only exception was the central bottom waters which had episodes of very low oxygen levels due to the breakdown of organic material and a lack of mixing caused by stratification.
When the bar was closed, dissolved oxygen concentrations ranged from 8-9 mgL-1 in surface and bottom waters. These results indicate excellent water quality.
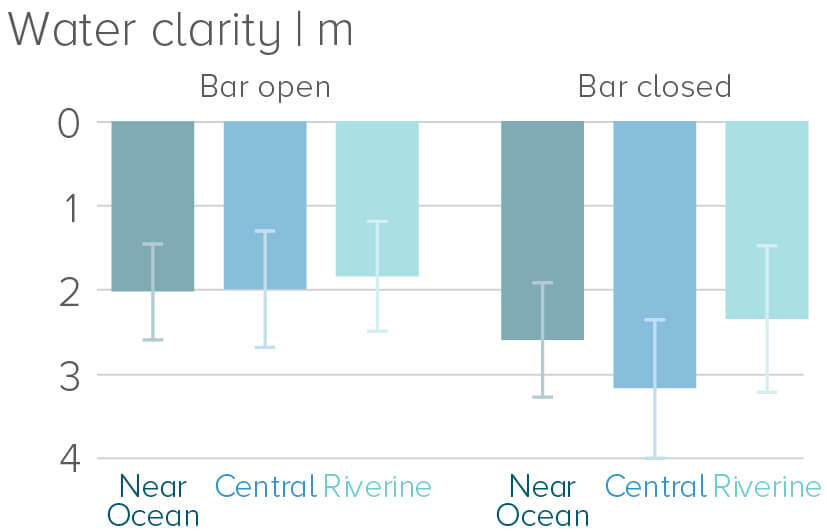
Water clarity
Water clarity is a measure of how far light penetrates into the water.
The water clarity was reasonably good when the bar was closed. There was less light penetration when the bar was open but still enough for healthy seagrass growth in depths to three metres.
*Water clarity is measured as Secchi depth
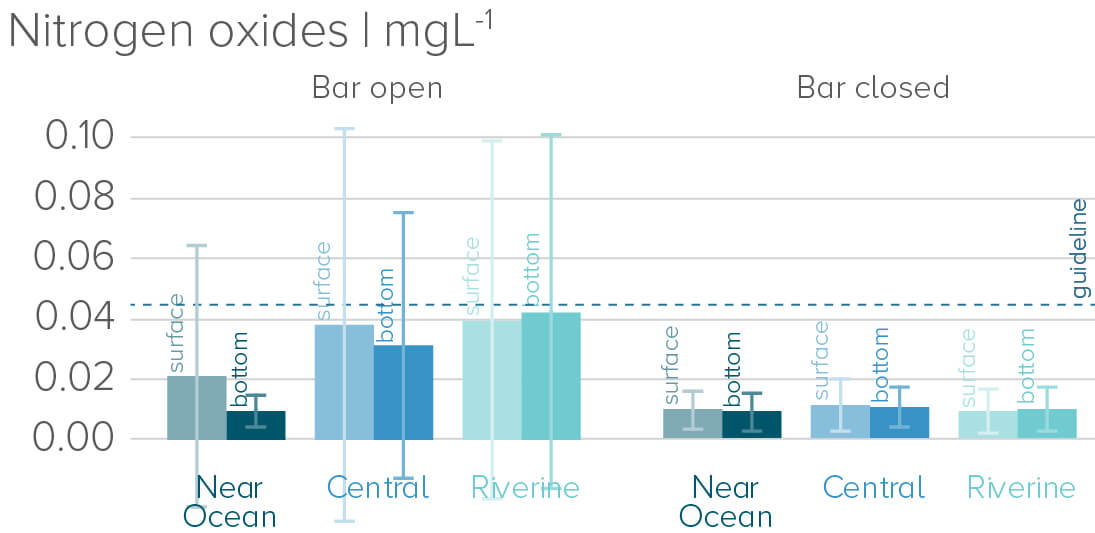
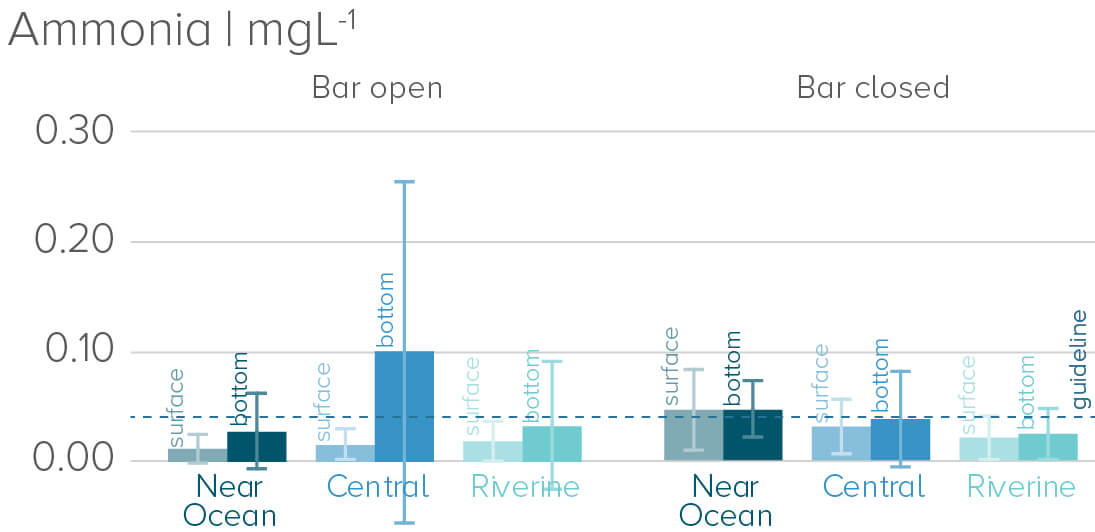
Nitrogen
Nitrogen is are measured as nitrate and ammonium depending on their source however, both contribute to the overall nutrient levels in estuaries. Both of these forms are dissolved and readily available to algae for growth.
When the bar was open, nitrate-nitrogen levels were close to the guideline value in surface waters. Freshwater inflows are the main source of nitrate and high concentrations in the estuary represents a leakage of agricultural fertilisers from the catchment which fuels algal activity. When the bar was closed and less water was flowing in from the catchment, nitrate was well below the guideline values.
Ammonium-nitrogen was close to the guideline value for the most part. The bottom waters of central basin sites were well in excess of the guideline. This was most likely due to the release of ammonium, from the sediments during very low oxygen (anoxic) conditions caused by stratification.
The guideline values are an indication of the approximate nitrogen levels that may impact the health of an estuary.*Guideline is the ANZECC (2000) guideline value for south-west estuaries
**Nitrogen measured as nitrate and nitrite – N and ammonium-N
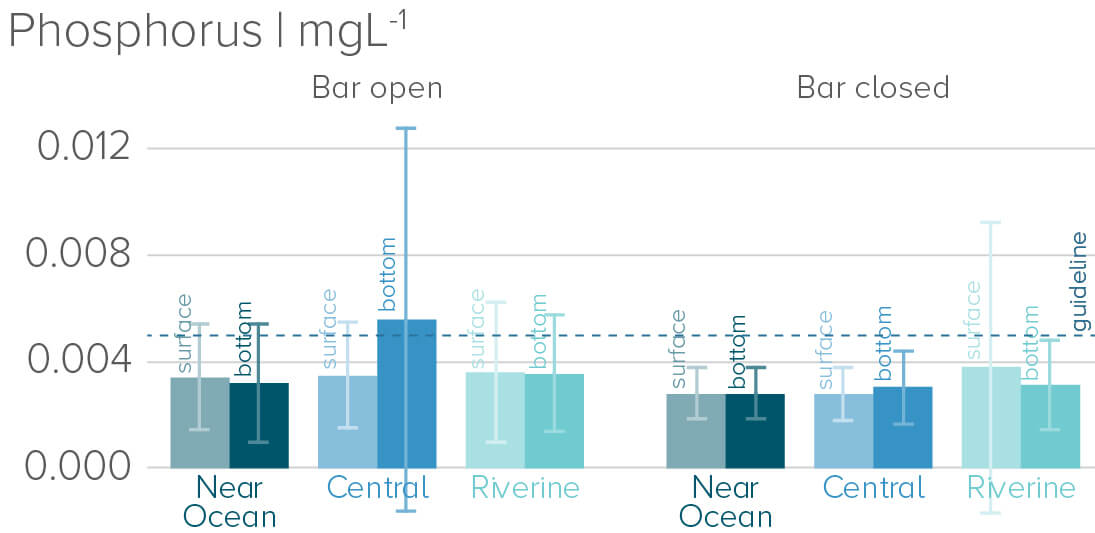
Phosphorus
Phosphorous levels in Wilson Inlet tended to be below the guideline value. The guideline values are an indication of the approximate phosphorous levels that may impact the health of an estuary.
The central deeper zone had phosphate levels above the guideline in the bottom layer when the bar was open. This was most likely due to the release of nutrients including phosphate from the sediments during very low oxygen (anoxic) conditions caused by stratification.
*Guideline is the ANZECC (2000) guideline value for south-west estuaries
** Phosphorous measured as filterable reactive phosphorous (phosphate – P)
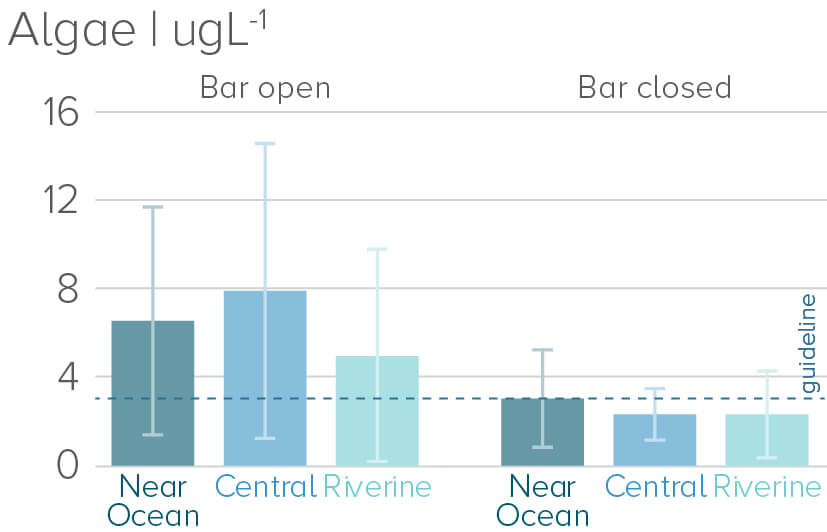
Algae
Algae levels in Wilson Inlet were close to the guideline value for the bar closed period and two to three times higher than the guideline when open.
High algal activity during the bar open period corresponds to spring blooms, a typical feature of south west estuaries following high river inflows and warmer temperatures.
*Guideline is the ANZECC (2000) guideline value for south-west estuaries
** Algae measured as chlorophyll a Near Ocean = WI-30